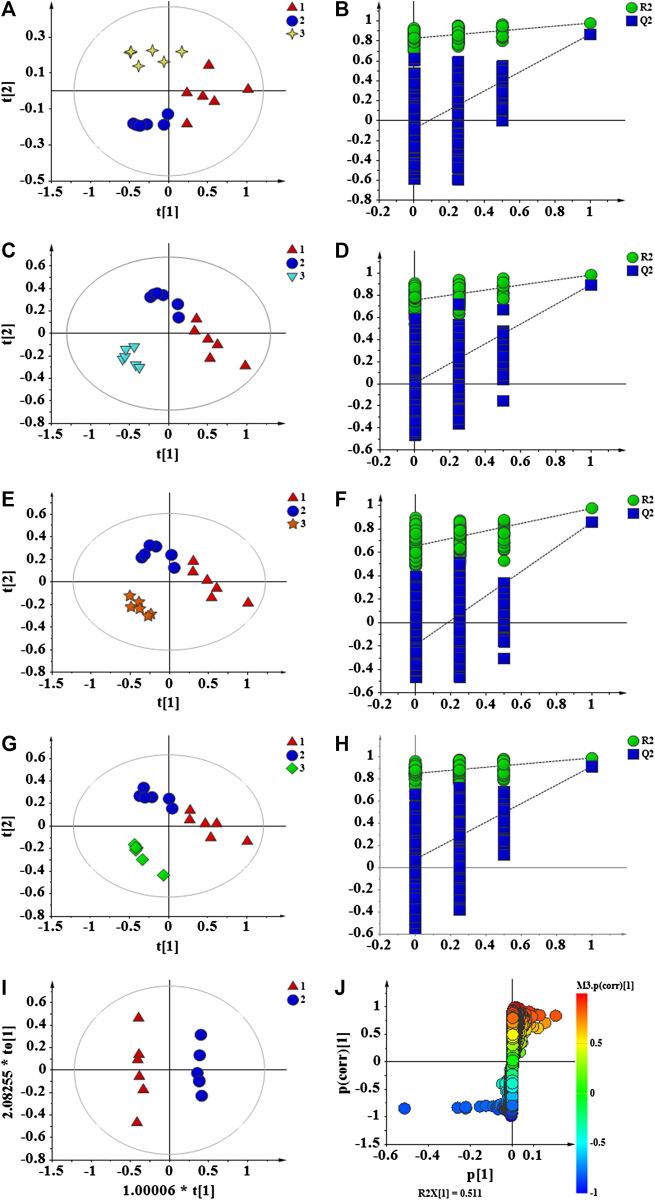
FIGURE 8.
PLS-DA score plots of C, M and APS (A); permutation test of C, M and APS (B); PLS-DA score plots of C, M and APS-I (C); permutation test of C, M and APS-I (D); PLS-DA score plots of C, M and APS-II (E); permutation test of C, M and APS-II (F); PLS-DA score plots of C, M and APS-III (G); permutation test of C, M and APS-III (H); OPLS-DA score plots of C and M (I); S-plot of C and M (J). C: Control group, M: Model group. 1 (Triangle) = M, 2 (circle) = C, 3 (4-plot star) = APS, 3 (inverted triangle) = APS-I, 3 (5-plot star) = APS-II, 3(diamond) = APS-III.

