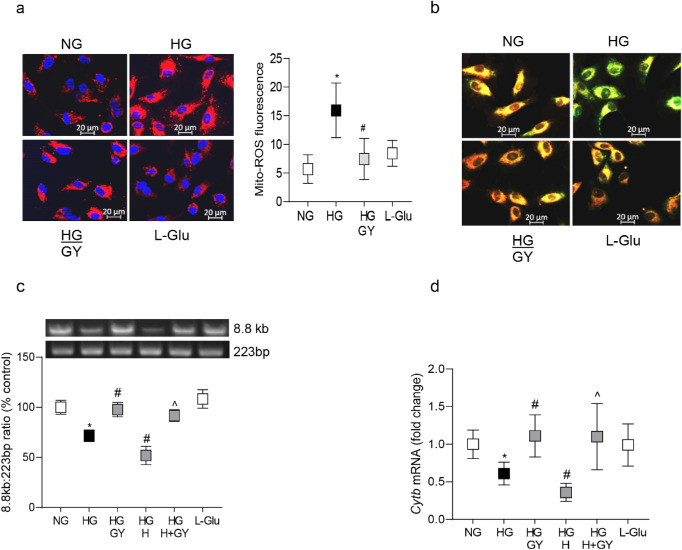
Figure 7.
Glucose-induced mitochondrial damage and H2S donor. (a) Mitochondrial ROS were quantified by MitoSOX Red and imaged at 20 times magnification using Apotome microscope, and the histogram represent the fluorescence intensity quantified by ImageJ, from 5 to 8 images/group. (b) Mitochondrial membrane potential was determined by cationic dye JC-1, and while green fluorescence represents the depolarized (monomer) mitochondria, orange represents hyperpolarized (J aggregates) mitochondria. (c) Damage to the mtDNA was quantified by extended-length PCR using long mtDNA (8.8 kb) and short (223 bp) amplicons of the mtDNA. (d) Gene transcripts of Cytb were quantified by qRT-PCR using β-actin as the housekeeping gene. Each measurement was made in duplicate/triplicate in four to five different cell preparations, and the histograms represent values mean ± SD. NG, cells in 5 mM glucose; HG and HG/GY, cells in 20 mM glucose without and with GY, respectively; HG/H and HG/H + GY, cells in high glucose + homocysteine, in the absence and presence of, respectively; LGlu, cells in 20 mM L-glucose. *P < 0.05 versus NG; #P < 0.05 versus HG; and ^P < 0.05 versus HG/H.

