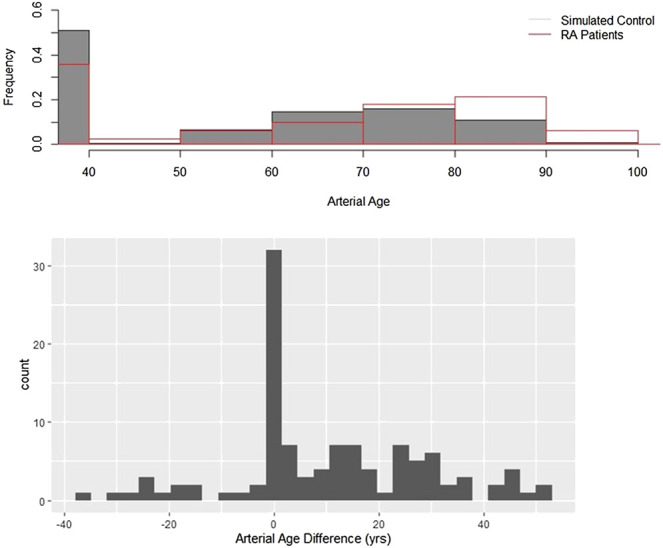
FIGURE 1.

Arterial age in rheumatoid arthritis. Upper panel: Arterial age, converted from the observed and age-, gender-, and race-adjusted simulated coronary calcium scores. The figure shows the resulting distributions of the observed and simulated data. The shaded bars are the simulated control subjects, and the transparent bars with red contours represent the observed values. Lower panel: Arterial age distributions of patients with RA and the control populations are different. artAge_dif is the difference between the observed and the median of the control arterial ages. If there is no difference between RA patients and control subjects, then the histogram of artAge_dif must be symmetric around zero. Using Wilcoxon signed test, we showed that this null hypothesis is unlikely (p < 0.001).
