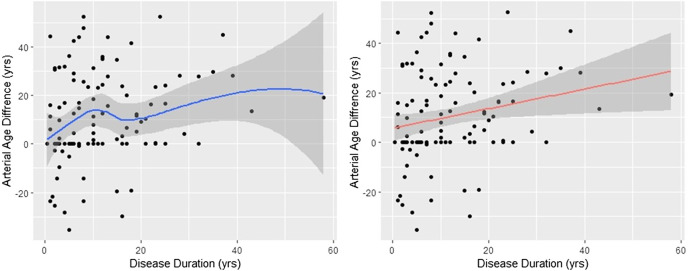
FIGURE 3.
Arterial age difference depends on the disease duration. The effect of disease duration on the arterial age difference between RA patients and controls is shown. The smoothed curve in the left figure was obtained with Lowess. On the right figure, the red line represents the fitted regression line. The slope of the regression line (slope = 0.395, t = 2.74, p = 0.007) is the yearly divergence rate from the control. In both cases, the shaded areas around the lines are the 95% confidence intervals. The arterial aging is approximately 40% accelerated.

