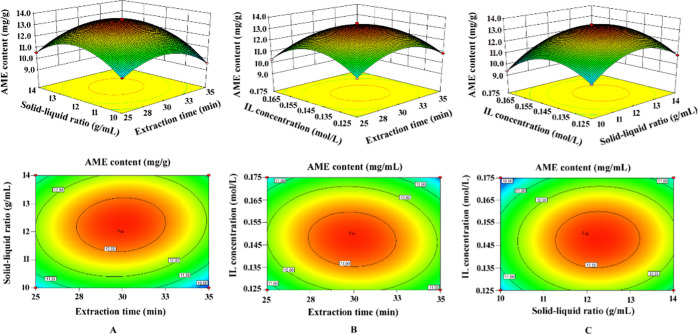
Figure 6.
Three-dimensional surface and contour map of the interaction between each of the two factors in response surface analysis on the yield of AME. Interactions between (A) extraction time and solid–liquid ratio, (B) extraction time and IL concentration, and (C) solid–liquid ratio and IL concentration.

