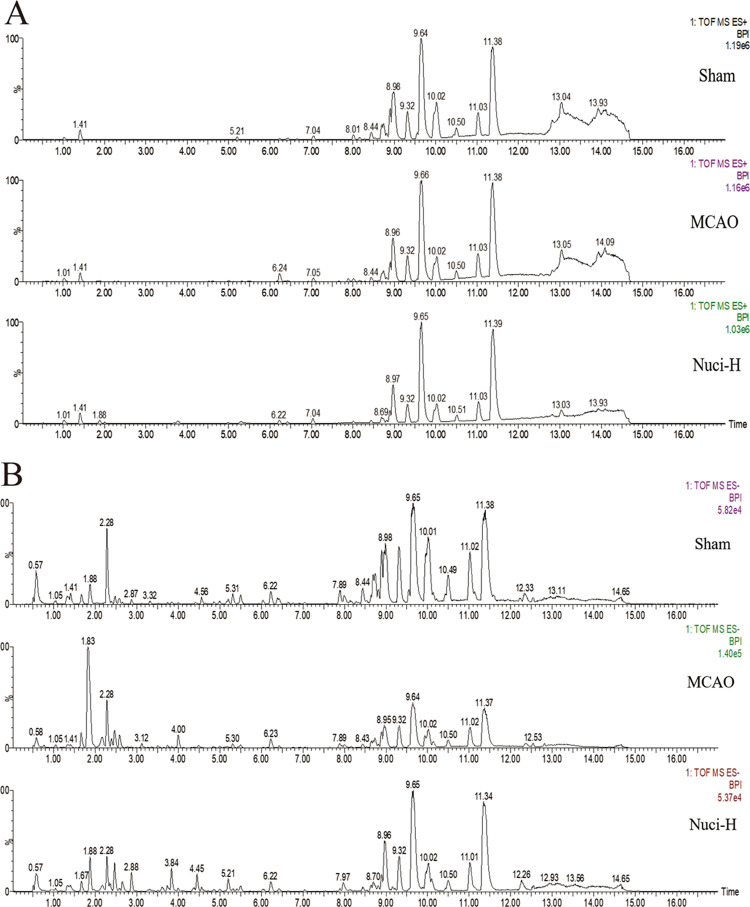
Figure 2.
Representative base peak intensity (BPI) chromatograms of the rat serum from the treatment groups. The peaks were acquired via analyses of serum samples of different groups in positive (A) and negative (B) modes. (A) (ESI+) and (B) (ESI–) from top to bottom show the sham group, MCAO group, and Nuci-H group.

