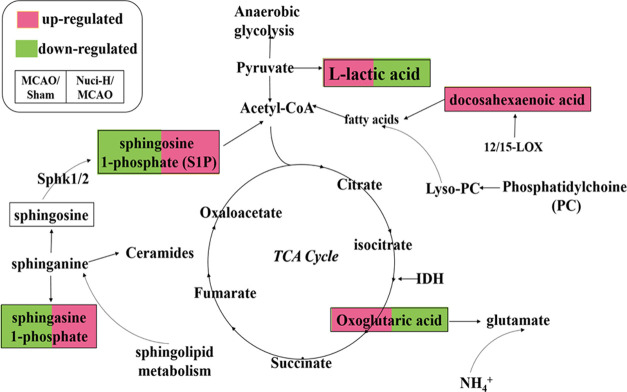
Figure 5.
Schematic diagram of the perturbed metabolic pathways that were detected by the UPLC/MS/MS, showing the network links between the identified biomarker pathways and MCAO-induced ischemic stroke. The red metabolites were upregulated, while the green metabolites were downregulated in the Nuci-H group compared to the MCAO group.

