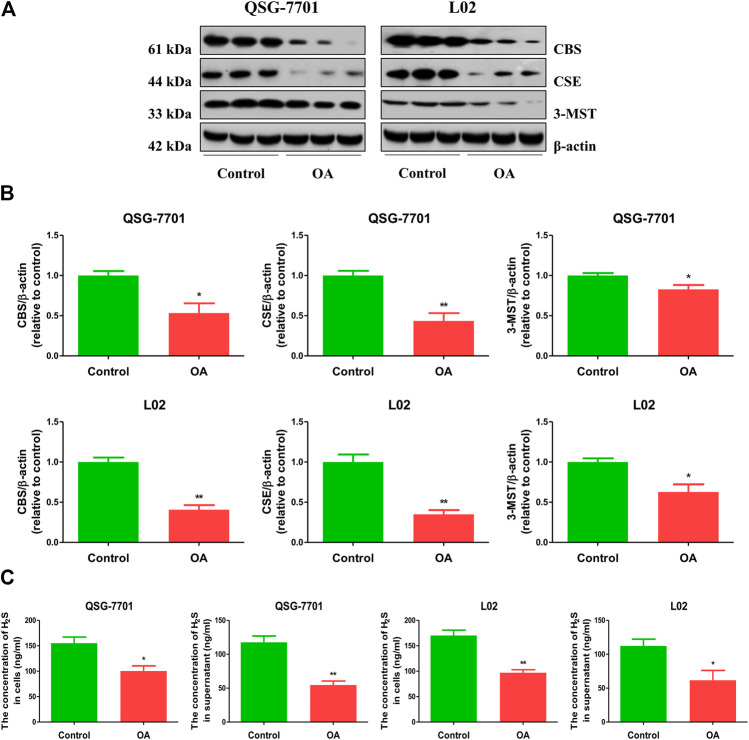
FIGURE 1.
The levels of endogenous H2S in normal and OA-treated QSG-7701 and L02 cells and culture supernatant. (A) The protein levels of CSE, CBS, and 3-MST were examined by Western blot. β-actin was used as a loading control. (B) The densitometric quantification was performed, normalized to the level of β-actin. (C) The levels of H2S in normal and OA-treated liver cells and culture supernatant. The experiments were performed in triplicates. Data are presented as mean ± SEM; *p < 0.05, **p < 0.01 vs. control group.

