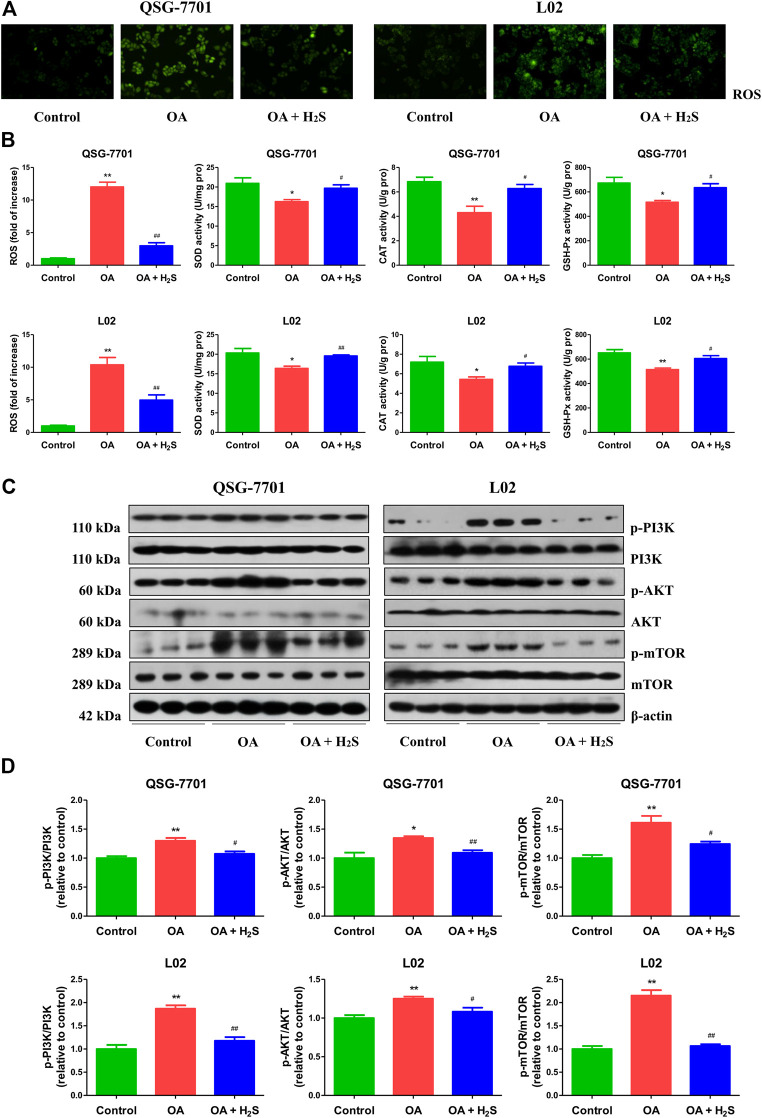
FIGURE 6.
The effect of H2S on ROS/PI3K/AKT/mTOR pathway in QSG-7701 and L02 cells treated with OA. (A) The ROS level was determined (original magnification, ×400). (B) The ROS levels and activities of SOD, CAT, and GSH-Px were detected. (C) The expression levels of PI3K, p-PI3K, AKT, p-AKT, mTOR, and p-mTOR were detected by Western blot. β-actin was used as a loading control. (D) The densitometric quantification was performed, normalized to the level of β-actin. The experiments were performed in triplicates. Data are presented as mean ± SEM; *p < 0.05, **p < 0.01 vs. control group; # p < 0.05, ## p < 0.01 vs. OA group.

