Figure 1.

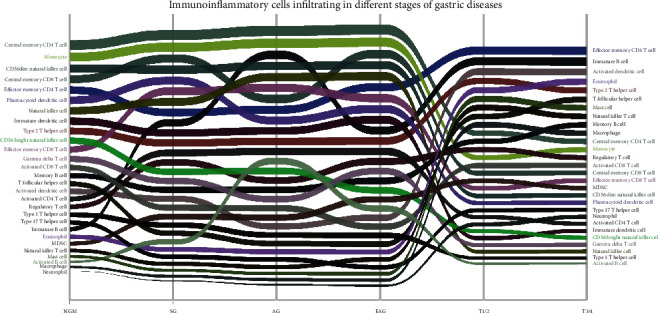
The abundance change of immunoinflammatory cells infiltrating in different stages of gastric diseases. The immune cells with a high ssGSEA score are in the upper part of the graph, and the ones of the low score are in the lower part.

The abundance change of immunoinflammatory cells infiltrating in different stages of gastric diseases. The immune cells with a high ssGSEA score are in the upper part of the graph, and the ones of the low score are in the lower part.