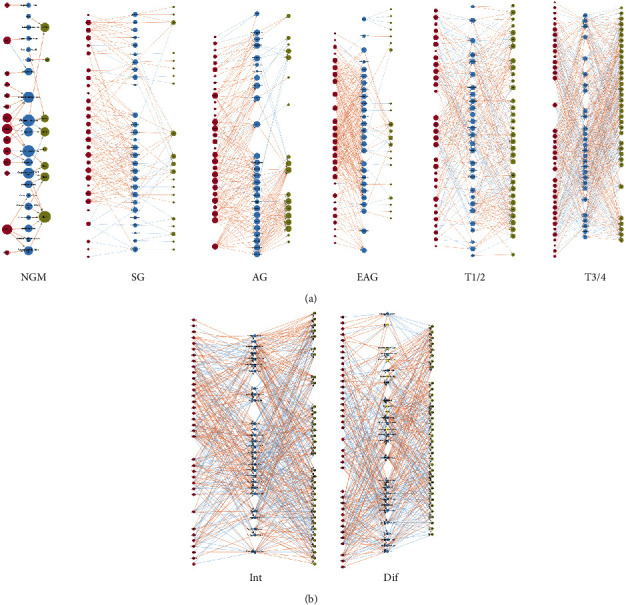
Figure 5.

Correlation between the number of immune cells and the expression of cytokines and chemokines in different stages of gastric diseases at static level. Red circles indicate chemokines; blue circles indicate immune cells; grass green circles indicate interleukins. (a) At different stages of gastric diseases (from Min to T3/4); (b) at different Lauren classifications.
