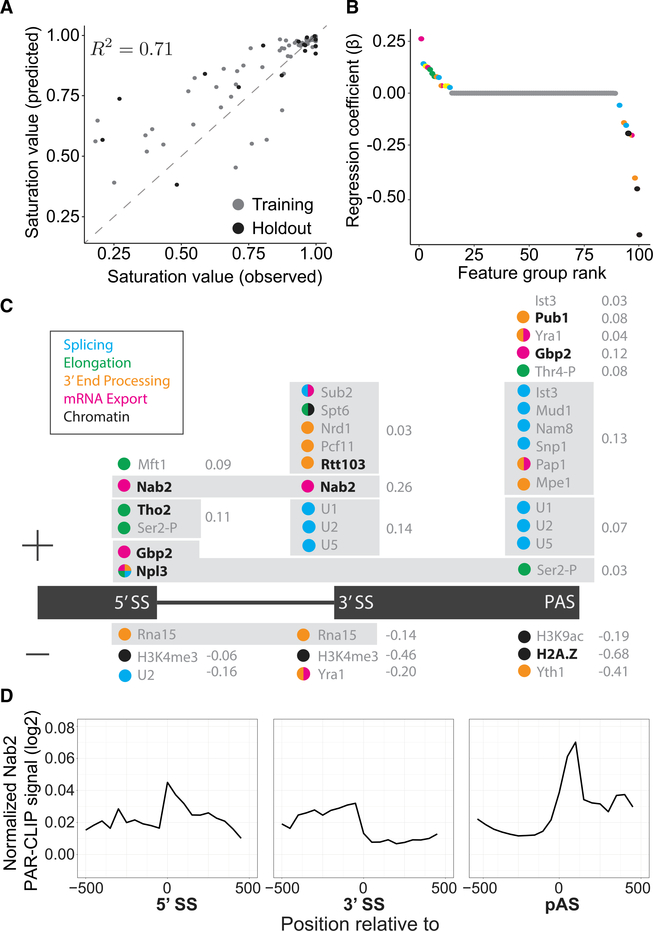
Figure 1. Machine Learning Predicts cis- and trans-Acting Factors Associated with Co-transcriptional Splicing.
(A) Observed and predicted saturation values are correlated with the variance explained (R2) as indicated for training (gray) and holdout (black) data.
(B) Feature groups used in the model are plotted according to their regression coefficient (b) and colored according to their cellular process (legend in C). Yellow indicates a feature group with mixed processes.
(C) Feature groups (gray box) are displayed above or below (positive or negative regression coefficient, respectively) the geneannotation(black) accordingto the genetic position where those features were identified as significant. Regression coefficient values (gray) are indicated to the right of the feature group.
(D) Normalized PAR-CLIP signals for Nab2 are aligned to 5′ SSs, 3′ SSs, and poly(A) sites (PASs) of all intron-containing genes in budding yeast (data from Baejen et al., 2014).

