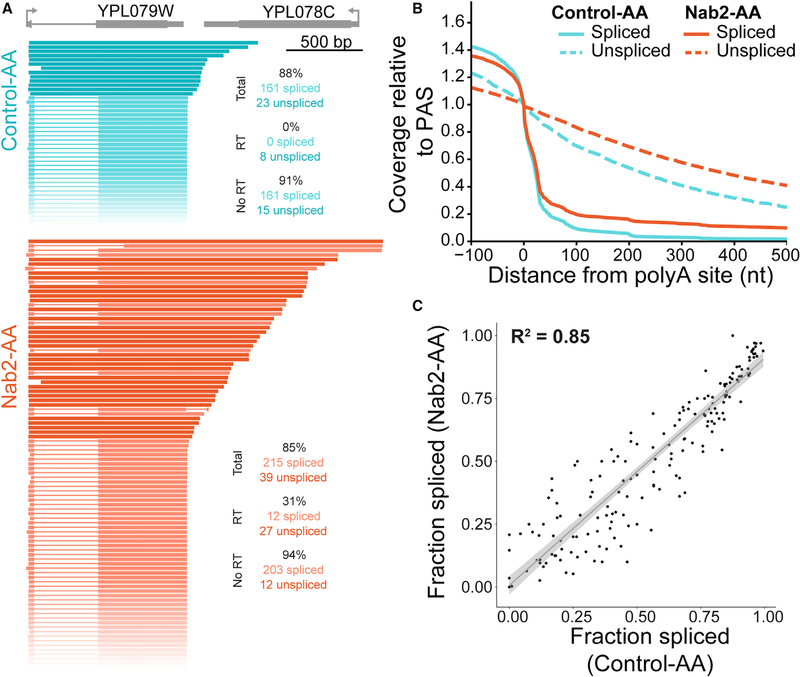
Figure 3. Long-Read Sequencing Reveals Transcriptional Readthrough upon Nab2 Depletion.
(A) Nanopore sequencing reads were sorted by 3′ end position for YPL079W (gray) for Control-AA (teal) and Nab2-AA (orange) samples. Reads were filtered for overlap with the intron-containing gene and must start no more than 100 bp downstream of the annotated TSS. Unspliced reads are displayed as a solid lineina darker color, and spliced reads are shown in a lighter color, with a thin line representing missing sequence information. All reads shown arise from the Watson strand. Read count and fraction spliced (percent) are shown.
(B) Coverage of reads downstream of the PAS was normalized to the signal at the PAS.
(C) The fraction spliced per gene is calculated for long reads that start within 50 bp of the annotated TSS and is plotted for Control-AA and Nab2-AA. The adjusted R2 value is displayed for the linear regression fit (gray line) and 95% confidence interval (gray ribbon).
Data from two biological replicates were first analyzed separately and then combined for display upon qualitative agreement between replicates.

