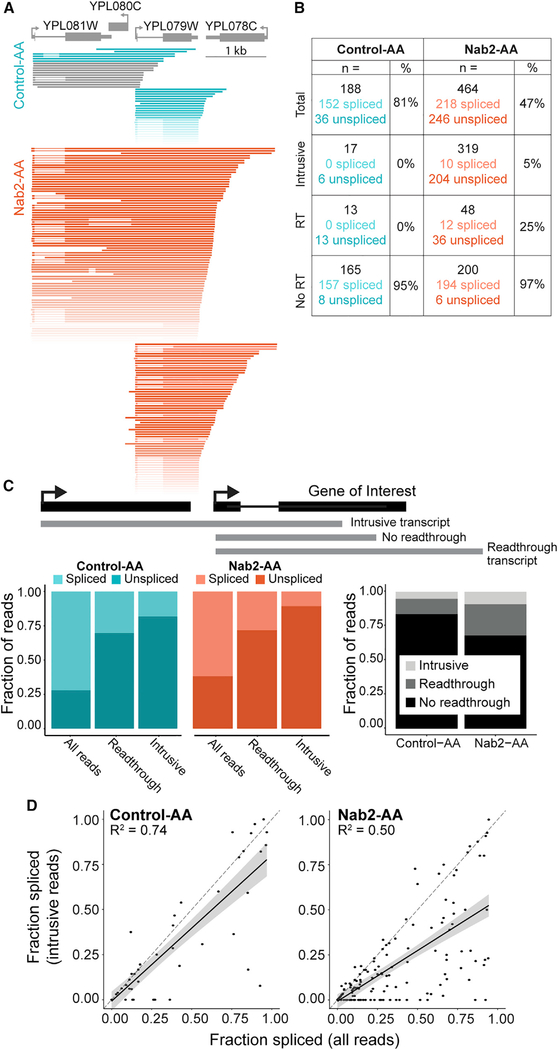
Figure 4. Intrusive Transcripts Generated by Transcriptional Readthrough Are Poorly Spliced.
(A) Nanopore reads aligned to YPL079W (gray) were filtered to start no more than 100 bp downstream of the TSS. Intrusive reads that began more than 100 bp upstream of the TSS are displayed separately above reads that began near the TSS. Reads that do not span the entire intron of YPL079W are colored gray and were not included in spliced/unspliced values in (B). Reads are colored a darker shade of teal (Control-AA) or orange (Nab2-AA) when the YPL079W intron is unspliced. All reads shown arise from the Watson strand.
(B) Read counts (n =) are displayed for each category diagrammed in (C). The number of spliced and unspliced reads is also indicated alongside the fraction spliced (percent).
(C) Top: gene diagram (black) showing how example reads (gray) are classified according to readthrough status relative to the intron-containing gene. Left: colored bar plots showing the fraction of reads that are spliced or unspliced in each readthrough category. Right: grayscale bar plots showing the fraction of reads for each dataset that belong to the three readthrough categories (see legend).
(D) The fraction spliced is calculated for each gene using all reads or only intrusive reads and plotted for each condition. Values arising from less than 10 reads were removed. Reads that begin more than 50 bp upstream of the annotated TSS are defined as intrusive. The dashed line (gray) is y = x, and the black line is a linear regression model fit to the data with a 95% confidence interval. R2 for the model is displayed on each plot (p < 2.2 × 10⁻¹⁶ for both).
Data from two biological replicates were combined after confirming agreement between replicates for each parameter.

