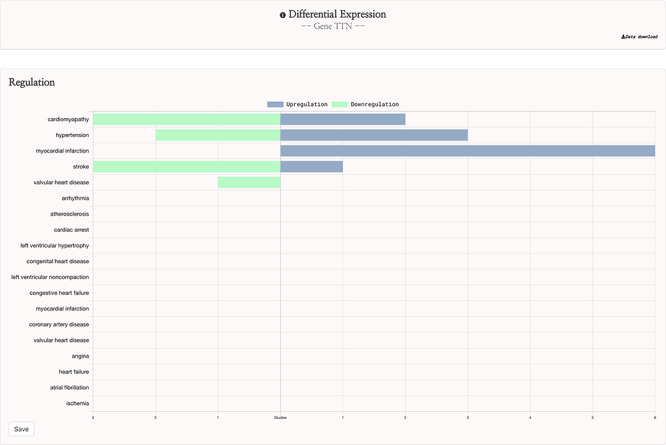
Figure 3.

HeartBioPortal2.0’s differential gene expression feature. Users can visually explore the landscape of up- and downregulation of any gene across a variety of CVD-relevant phenotypes from GEO studies that have been further manually curated and harmonized for HeartBioPortal inclusion via a uniform data-processing pipeline (as described in Methods section). In addition, the Data Download button provides actionable metadata such as FDR adjusted P-value, fold change (presented as logFC) and PMID to facilitate exploratory data analyses.
