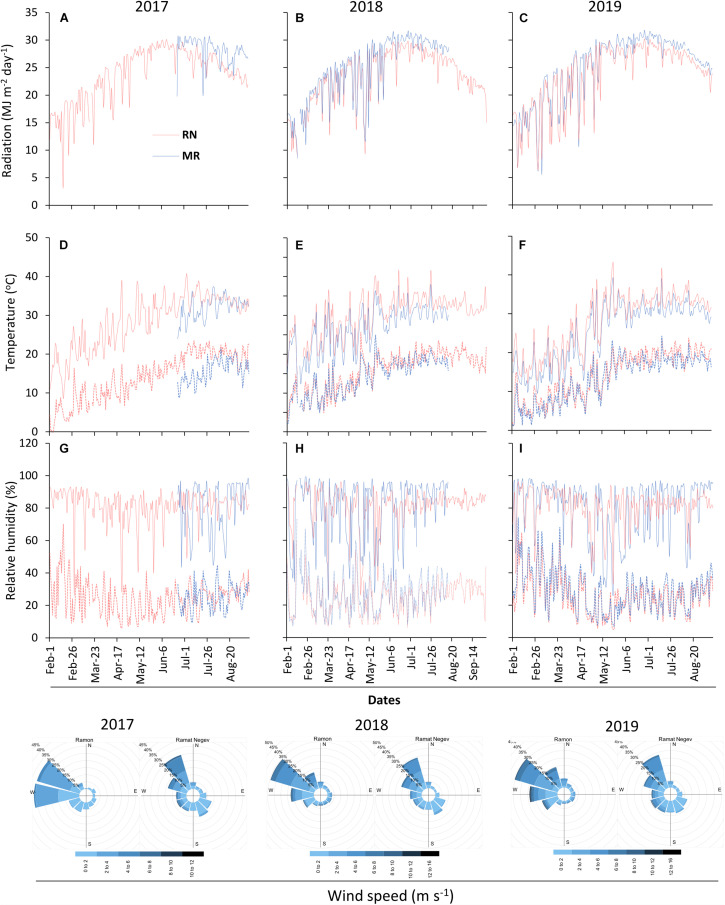
FIGURE 2.
Meteorological conditions at the experimental sites. Radiation (A–C), temperature (D–F), relative humidity (G–I), and wind speed were continuously measured at 2 m above canopy during 2017–2019 seasons. The solid and dotted lines in the temperature and relative humidity graphs denote maximum and minimum measurements, respectively. RN, Ramat Negev; MR, Ramon. The 2017 data at Ramon vineyard are from 23rd May 2017 until harvest end.

