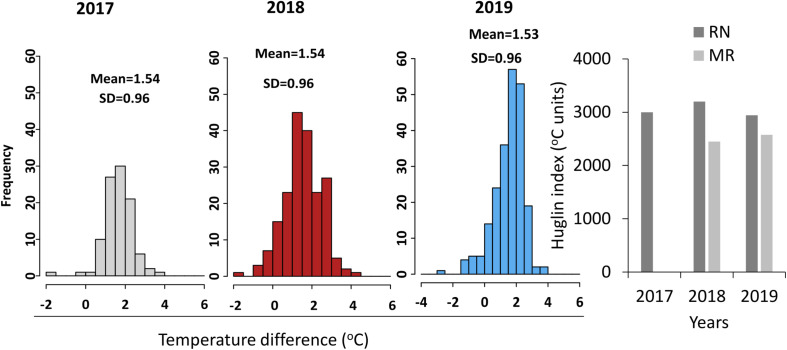
FIGURE 3.
Temperature and Huglin index differences between the sites. Histograms show the frequency distribution of mean daily temperature difference between Ramat Negev (RN) and Ramon (MR) (Ramat Negev-Ramon) vineyards in 2017 (gray), 2018 (red), and 2019 (blue) seasons. SD, standard deviation. The bar graph represents the Huglin index (HI) calculated from March to August. The temperature differences between the vineyards in the 2017 season were performed using the temperature data measured from 23rd May until the last harvest date 29th August. The 2017 HI of MR was not presented as the data were not available throughout the season.

