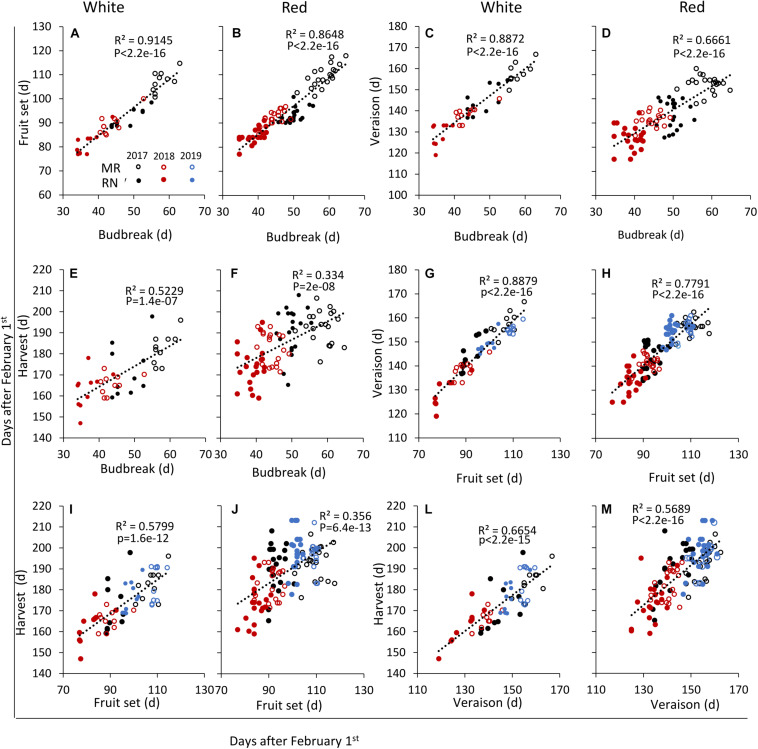
FIGURE 6.
Linear regressions between the timing of various pairs of phenological events in white and red wine grapevine cultivars, respectively, as follows: fruit set to budbreak, (A,B); véraison to budbreak, (C,D); harvest to budbreak, (E,F); véraison to fruit set, (G,H); harvest to fruit set, (I,J); and, harvest to véraison, (L,M). In each season, data are the average values of four biological replicates (each consisting of eight–nine plants) at Ramon (MR) and Ramat Negev (RN) vineyards. (d), days after February 1st until the onset of each phenological event. Open and close circles denote Ramon and Ramat Negev vineyard, respectively. Black, red, and blue indicate cultivars grown in 2017, in 2018, and in 2019, respectively. See Supplementary Table 2.

