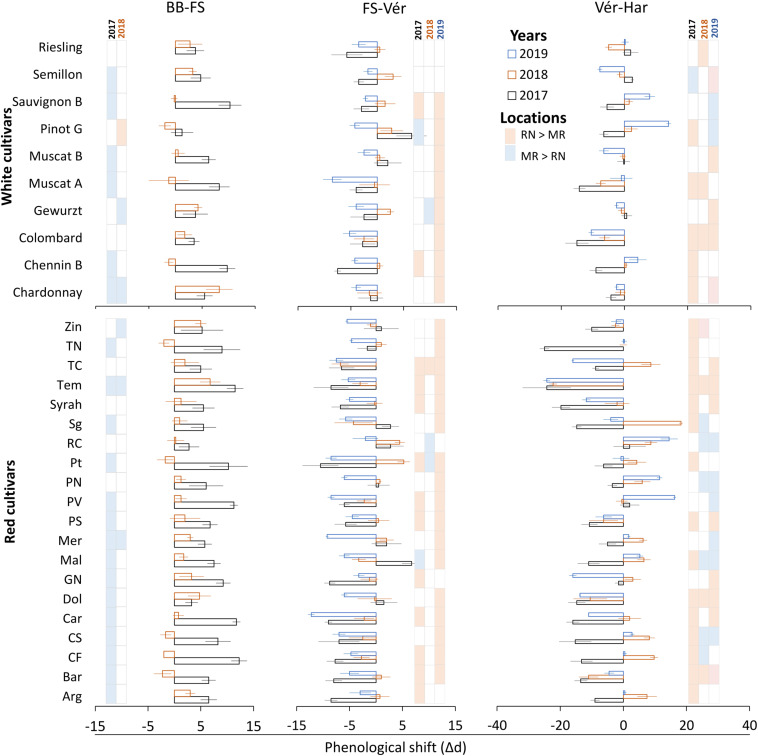
FIGURE 7.
Differences between vineyards in the duration of phenological phases in white and red grapevine cultivars during 2017, 2018, and 2019 growing seasons. Calculated by subtraction of a given phase duration at Ramon (MR) from the respective phase at Ramat Negev (RN). Red and blue colors inside the grid represent significantly longer intervals at Ramat Negev and Ramon, respectively. Error bars are standard error (n = 4); d, days; BB, bud break; Fs, fruit set; Vér, véraison; Har, harvest. The data for BB-FS intervals are only from the 2017 and 2018 seasons (see Table 2).

