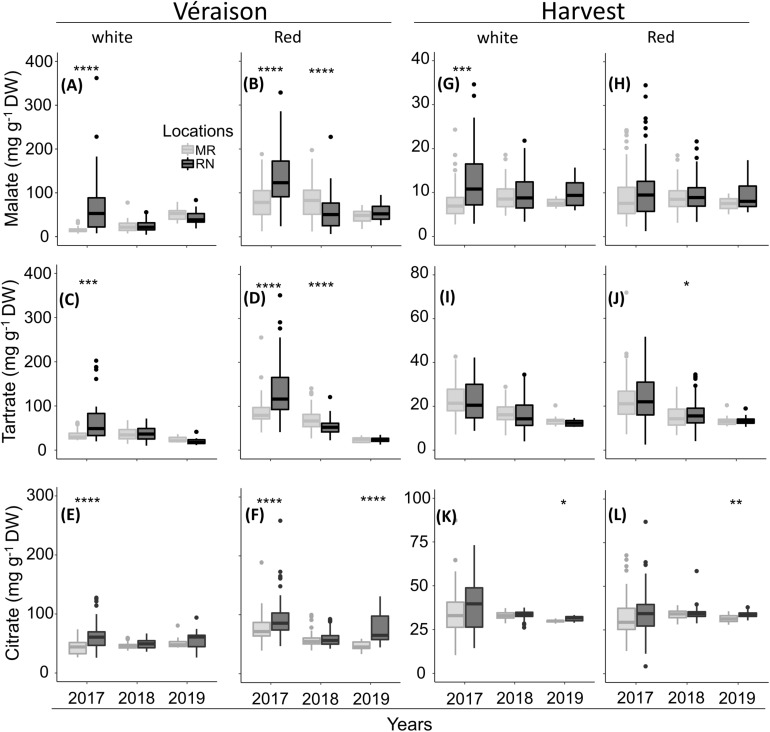
FIGURE 8.
The pulp organic acids at véraison (A–F) and harvest (G–L) in white (A,C,E and G,I,K) and red (B,D,F and H,J,L) cultivars grown at Ramon (MR) and Ramat Negev (RN) vineyards from 2017 to 2019. Data for 2017 and 2018 are the average value across all white (n = 4 replicates × 10 cultivars) and red (n = 4 replicates × 20 cultivars) cultivars at Ramon and Ramat Negev vineyards. Data of 2019 are the average value across all white (n = bulked replicate × 10 cultivars) and red (n = bulked replicate × 20 cultivars) cultivars at Ramon and Ramat Negev. Box limits are first and third quartile. Boxplots followed by asterisks indicate significant difference at *P < 0.05, **P < 0.01, ***P < 0.001, and ****P < 0.0001 level between vineyard locations within the same year based on non-parametric t-test (see Supplementary Tables 6, 7).

