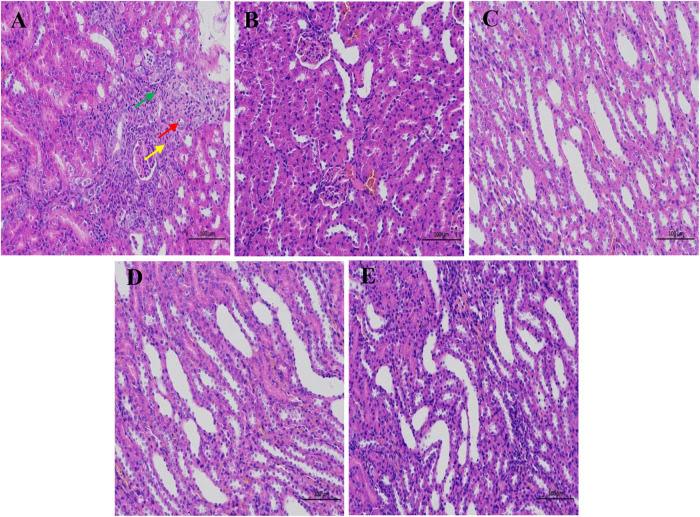
FIGURE 3.
The pathological changes of the kidney tissue of rats in different treatments. (A–E) represent the M group, NC group, CPS group, SPS group, and furosemide group, respectively. Red arrows show local cortical renal tubular atrophy, lumen stenosis, and epithelial cell volume reduction. Yellow arrows show interstitial connective tissue hyperplasia, and green arrows show a small amount of lymphocyte infiltration. Scale bar = 100 μm.

