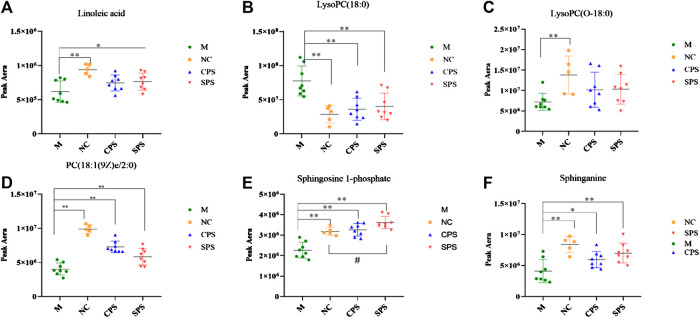
FIGURE 9.
Relative content of common metabolites in the CPS, SPS, and NC groups vs. the M group. # p < 0.05 vs. the NC group; *p < 0.05 vs. the M group; **p < 0.01, vs. the M group. (A) Linoleic acid; (B) lysoPC(18:0); (C) lysoPC(O-18:0); (D) PC(18:1(9Z)e/2:0); (E) sphingosine-1-phosphate; and (F) sphinganine. Six common but major feature metabolites of the CPS and SPS groups were significantly reversed compared to the M group with using a multiple t-test and the results were showed in the plots.

