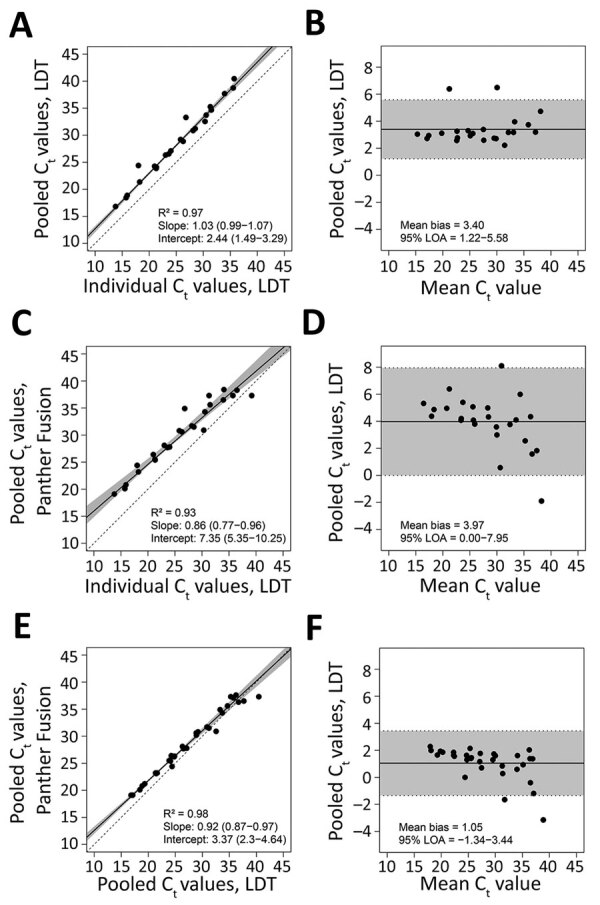
Figure 2.

Performance of nucleic acid amplification tests for detection of severe acute respiratory syndrome coronavirus 2 in prospectively pooled specimens. Passing-Bablok regression and Bland-Altman plots for pools of 8 containing only 1 positive sample, tested by A and B) pooled LDT versus individual LDT (n = 23) (A, B); pooled Panther Fusion versus individual LDT (n = 25) (C, D); and pooled Panther Fusion versus pooled LDT (n = 32) (E, F). For the Passing-Bablok regression plots (A, C, and E), the solid line indicates the line of regression. 95% CIs are shaded in gray. The dashed line indicates the line of identity. The slope and intercept of the regression line are reported with 95% CIs in parentheses. For the Bland-Altman plots (B, D, and F), the solid line represents the mean difference in Ct value. 95% limits of agreement are shaded in gray. Panther Fusion is from Hologic (https://www.hologic.com). Ct, cycle threshold; LDT, laboratory-developed test; LOA, limits of agreement.
