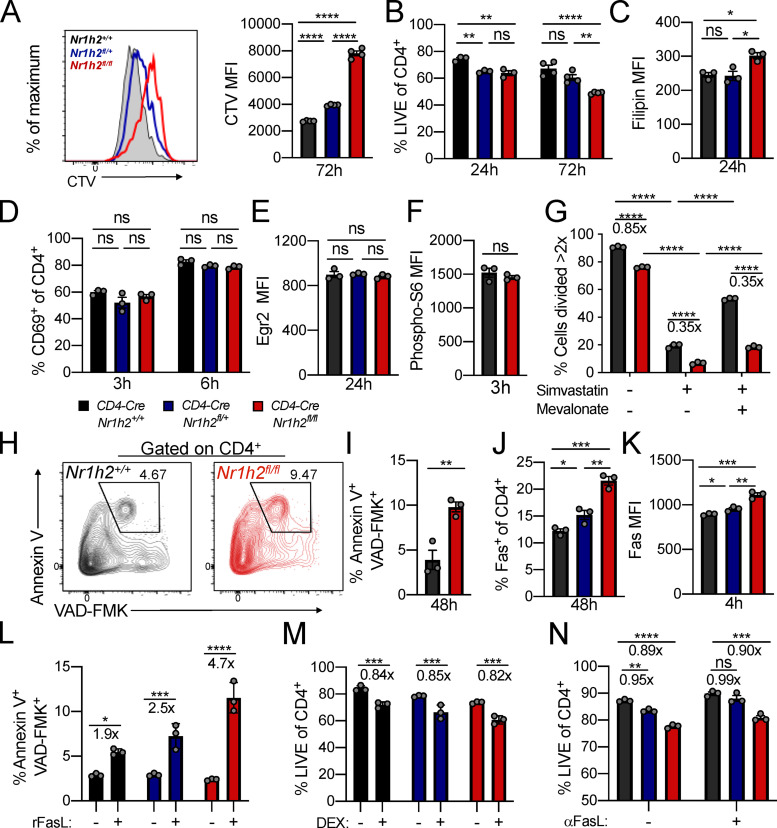
Figure 3.
Cell-intrinsic expression of LXRβ regulates T cell survival upon activation. (A–N) Naive CD4+ T cells sorted from CD4-CreNr1h2+/+, CD4-CreNr1h2fl/+, or CD4-CreNr1h2fl/fl mice were activated in vitro with CD3 and CD28 antibody–coated beads in the presence of 100 U/ml IL-2 and analyzed at the indicated time points. (A) Representative histogram (left) and quantification of mean fluorescence intensity (MFI; right) of CellTrace Violet (CTV) label dilution 72 h after activation. (B) Percentages of live cells in culture. (C) Filipin III MFI. (D) Percentage of cells expressing CD69. (E and F) Expression of Egr2 (E) and phosphorylated S6 (F) by indicated cell types. The data are shown as MFI. (G) Percentages of cells that divided more than twice in the presence of Simva (10 µM) and mevalonate (1 mM) 48 h after activation. (H and I) Representative flow cytometry plots (H) and percentage (I) of Annexin V+ Z-VAD-FMK+ cells 48 h after activation. (J) Percentages of cells expressing Fas. (K) Fas MFI. (L) Percentages of Annexin V+ Z-VAD-FMK+ cells after 4 h incubation with recombinant FasL. (M and N) Percentages of live cells after 48-h treatment with 1 µM dexamethasone (DEX; M) or FasL blocking antibody (N). Data are presented as mean ± SEM (n = 3). Ns, nonsignificant = P > 0.05; *; P < 0.05; **, P < 0.01; ***, P < 0.001; ****, P < 0.0001. Statistical significance was determined using one-way ANOVA (A–E, J–K, and N), two-way ANOVA (G), or multiple t tests (F and I) followed by the Holm-Šídák correction. Data are representative of at least two independent experiments.

