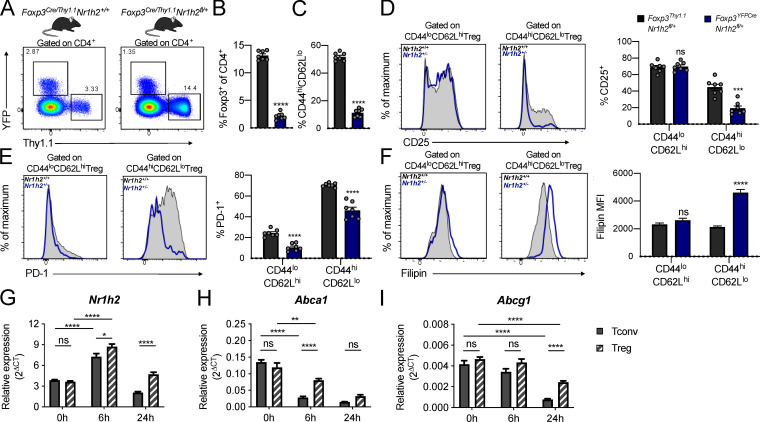
Figure 5.
LXRβ-deficient T reg cells are functionally impaired. (A–F) Analysis of 6–8-wk-old Foxp3YFP-Cre/Thy1.1Nr1h2+/− mosaic female mice. (A) Representative flow cytometry plots showing the percentage of reporter-positive cells in the spleens of Foxp3YFP-Cre/Thy1.1Nr1h2+/+ (left) and Foxp3YFP-Cre/Thy1.1Nr1h2fl/+ mice (right). (B) Frequencies of Thy1.1+ (Nr1h2+/+) and YFP+ (Nr1h2+/−) splenic T reg cells as a fraction of total CD4+ T cells. (C) Percentages of activated (CD44hiCD62Llo) cells among Thy1.1+ (Nr1h2+/+) and YFP+ (Nr1h2+/−) splenic T reg cells. (D and E) Expression of CD25 (D) and PD-1 (E) in the resting (CD44loCD62Lhi) and activated (CD44hiCD62Llo) T reg cell compartments. (F) Filipin III staining in the resting and activated T reg cell compartments. (G–I) Resting T reg cells (CD4+Foxp3+) and conventional T cells (CD4+Foxp3−) isolated from Foxp3GFP mice were activated in vitro with CD3 and CD28 antibody–coated beads in the presence of 100 U/ml IL-2. Relative quantification of Nr1h2 (G), Abca1 (H), and Abcg1 (I) mRNA levels by real-time quantitative at 0, 6, and 24 h after activation. Cycle threshold (Ct) values were normalized to β-actin. Data are presented as mean ± SEM (n = 5–7). ns, nonsignificant = P > 0.05; ***, P < 0.001; ****, P < 0.0001. Statistical significance was determined using a two-tailed T test (B and C), multiple t tests followed by the Holm-Šídák correction (D–F), or two-way ANOVA followed by the Tukey correction for multiple comparisons (G–I). Data are representative of at least two independent experiments.

