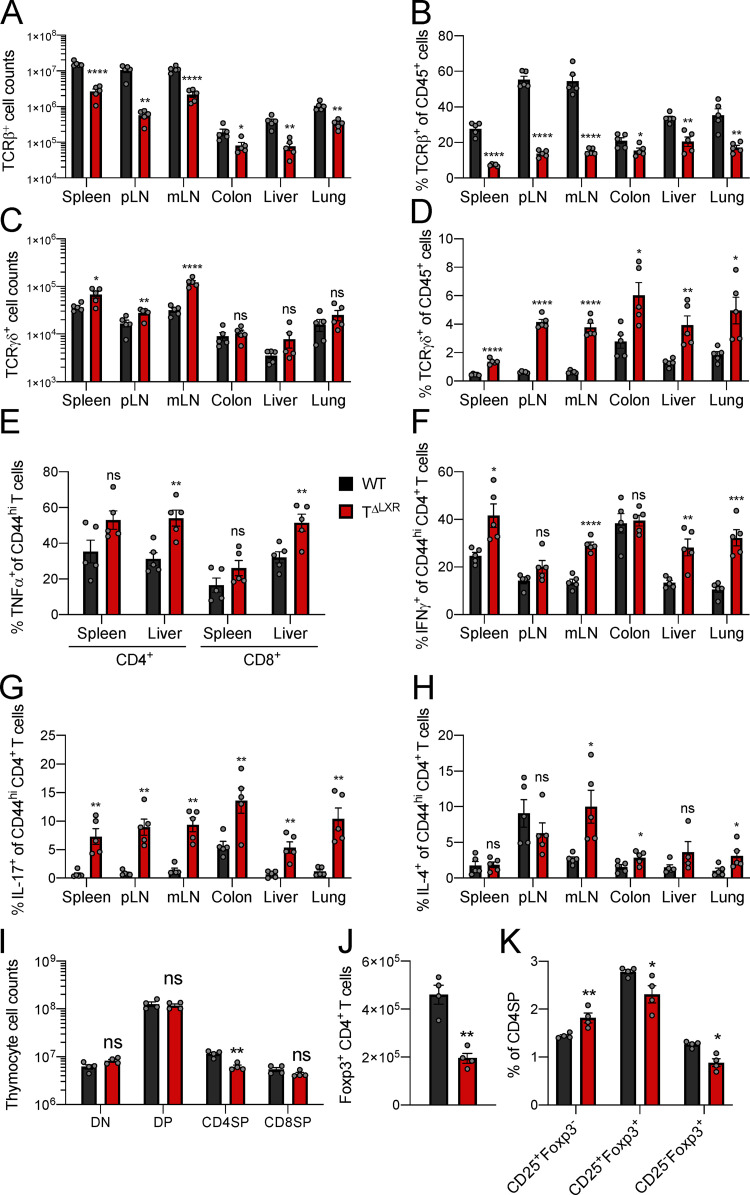
Figure S1.
Analysis of 6–8-wk-old CD4-CreNr1h2fl/fl (TΔLXR) and Nr1h2fl/fl (WT) littermate mice. (A) Quantification of TCRβ+ T cell numbers in indicated tissues. (B) Percentages of TCRβ+ T cells as a fraction of total CD45+ immune cells across indicated tissues. (C) Quantification of TCRγδ+ T cell numbers. (D) Percentages TCRγδ+ T cells among CD45+ cells. (E–H) Frequencies of effector T cells producing the indicated cytokines upon ex vivo restimulation with PMA and ionomycin in the presence of brefeldin A and monensin. (E) Percentages of CD4+ and CD8+ effector T cells producing TNFα. (F–H) Percentages of effector CD4+ T cells producing IFNγ (F), IL-17 (G), or IL-4 (H) in indicated organs. (I) Quantification of cell numbers within the indicated thymocyte subset. (J) Quantification of thymic CD4+Foxp3+ cells. (K) Frequencies of thymic T reg cell precursor subsets among CD4SP cells. Data are presented as mean ± SEM (n = 5). ns, nonsignificant = P > 0.05; *, P < 0.05; **, P < 0.01; ***, P < 0.001; ****, P < 0.0001. Statistical significance was determined using a two-tailed T test (J) or multiple t tests followed by the Holm-Šídák correction (A–I and K). Data are representative of at least three independent experiments. mLN, mesenteric LN.

