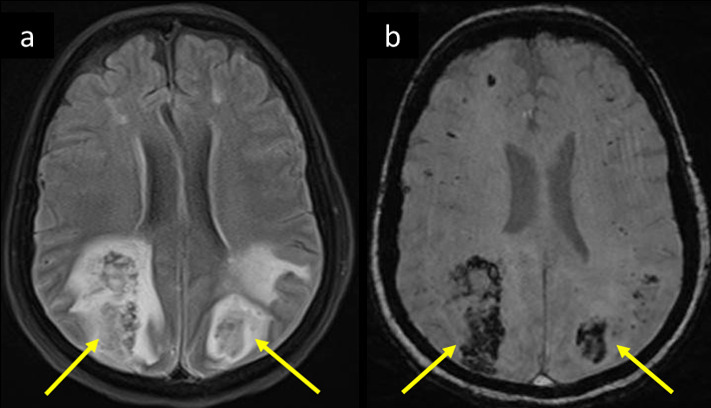
Figure 7.

Same patient as in Figure 6 showed progressive deterioration of GCS. Her follow-up MRI 3 days later, axial (a) T2-FLAIR shows bilateral parietooccipital white matter vasogenic edema with bright signal intensity, and hemorrhagic changes showing central areas of low signal intensity consistent with hemorrhagic PRES. Corresponding blooming of hemorrhages are seen on (b) magnitude image of SWI (arrows in a and b). GCS, Glasgow coma scale;FLAIR, fluid attenuated inversion recovery; PRES, posterior reversibleencephalopathy syndrome; SWI, susceptibility-weighted imaging.
