
Figure 2.
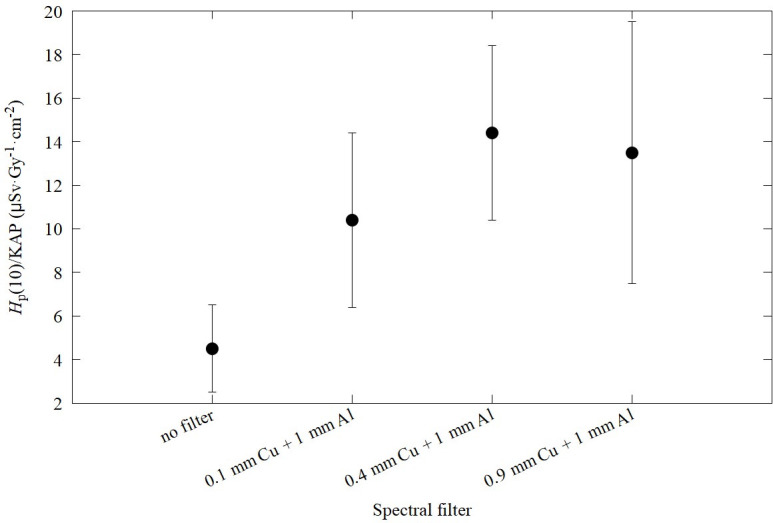
Hp(10) at C-arm/KAP vs beam filtration for the sample of events with restricted kV and C-arm close to PA projection (±10°). Each point represents the mean value and the standard deviation of the sample for radiation events with 75 < kV < 85 and −10° < C arm angles < 10°. Sample sizes ranged from a minimum of 223 to 6241 radiation events.