
Figure 5.
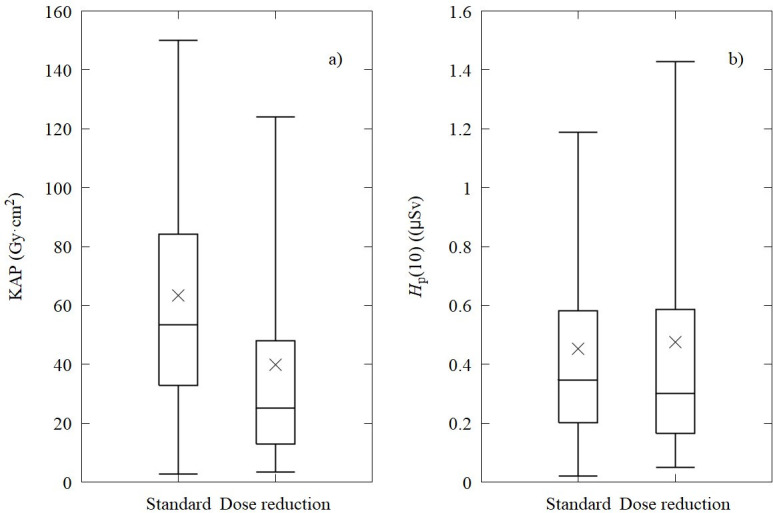
The KAP per procedure and the Hp(10) per procedure measured at the C-arm. Box graph shows the percentiles 5, 25, 50, 75 and 95%. The cross-point shows the average. As shown in Table 1, in the “dose reduction” system, 70% of the KAP was delivered with 0.4 mm Cu + 1 mm Al of added filtration. In the standard system, 70% of the KAP was delivered with no added filtration.