FIGURE 3.

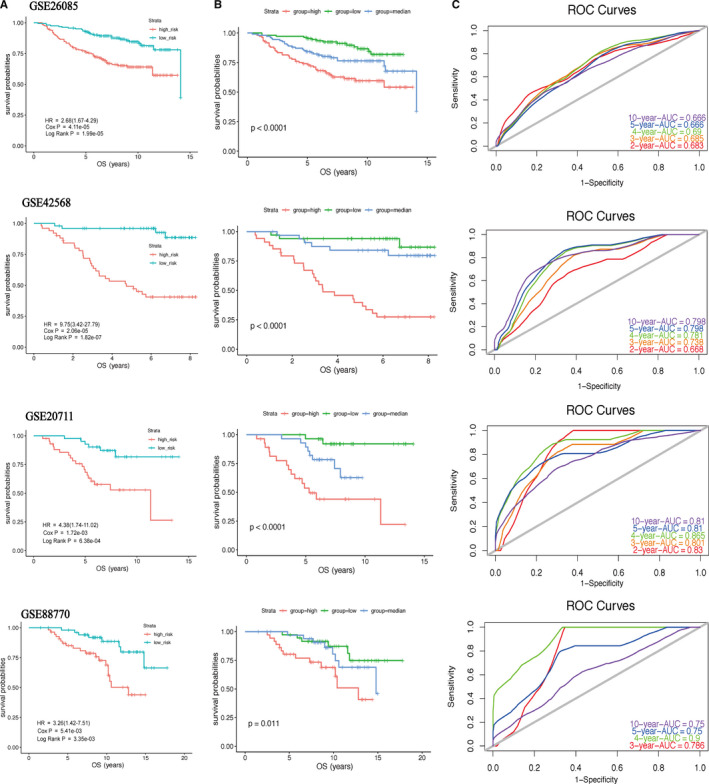
Kaplan–Meier plot (A, B) and ROC curves (C) for 9‐gene signature in four datasets. The OS of patients in the high‐risk group was lower than that in the low‐risk group. p value < 0.05 (log‐rank test) was considered statistically significant

Kaplan–Meier plot (A, B) and ROC curves (C) for 9‐gene signature in four datasets. The OS of patients in the high‐risk group was lower than that in the low‐risk group. p value < 0.05 (log‐rank test) was considered statistically significant