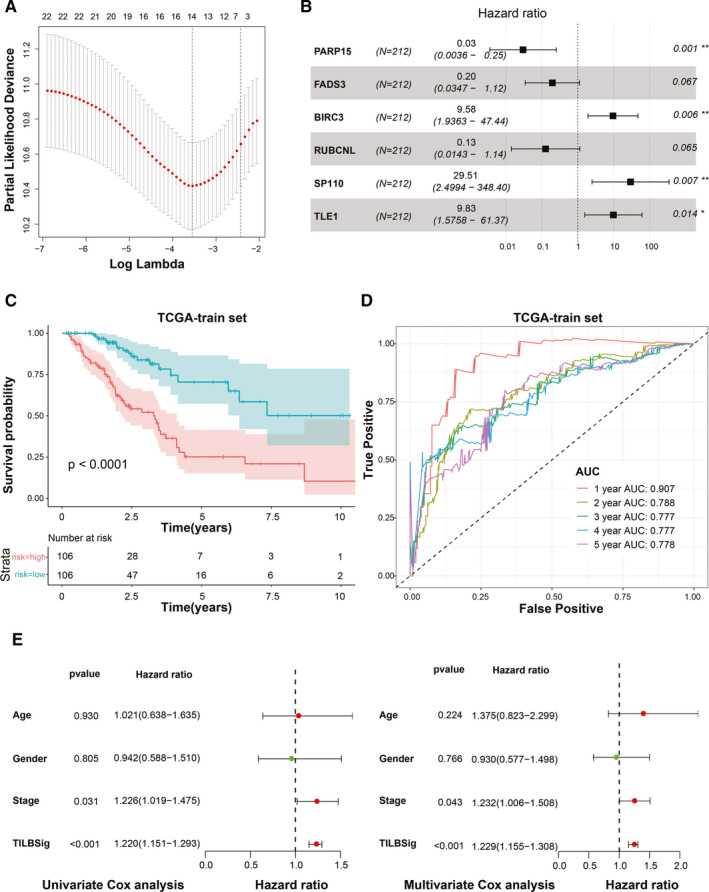
FIGURE 2.

Development of the TILBSig in the TCGA training set. A, LASSO Cox regression analysis for B cell‐specific genes. B, Forest plot visualizing the HRs of multivariate Cox analysis of six mRNAs in the TILBSig with the OS. C, Survival analysis between the high‐ and low‐risk groups stratified by the TILBSig in TCGA training set. D, Time‐dependent ROC curve for TCGA training set. E, Forest plot visualizing the HRs of univariate Cox and multivariate Cox analysis of the TILBSig and clinicopathological factors in TCGA training set
