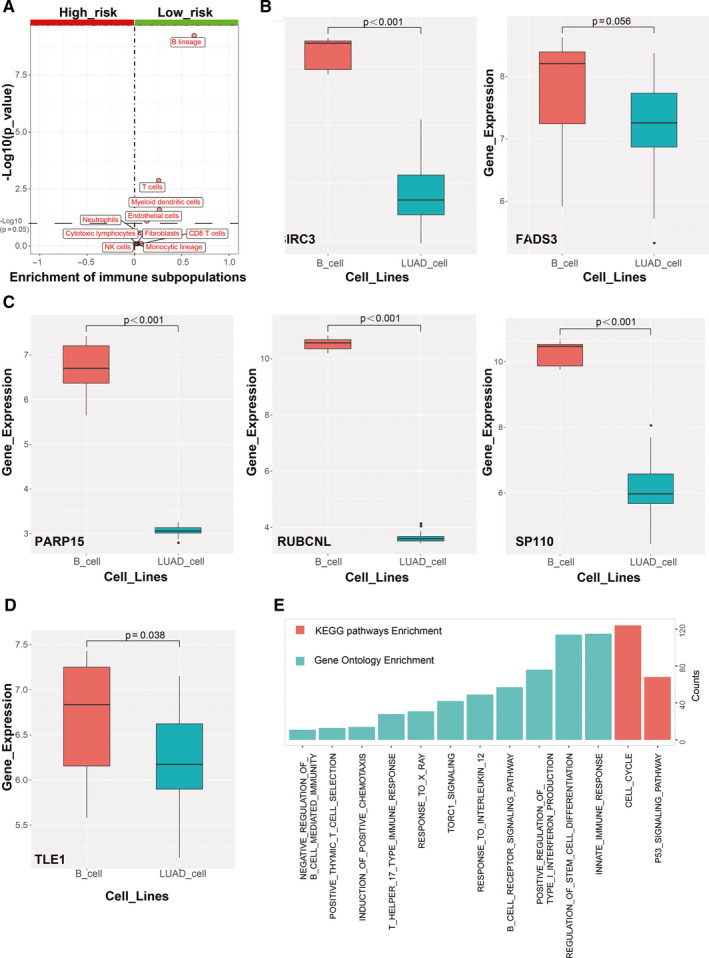
FIGURE 4.

Functional analysis of TILBSig. A, Volcano plots for difference of immune subpopulations fraction between the high‐ and low‐risk groups. B–D, Boxplots for the differential of genes expression between B cell lines and LUAD cell lines. E, Enrichment analysis of GO and KEGG pathways for TILBSig‐related genes.
