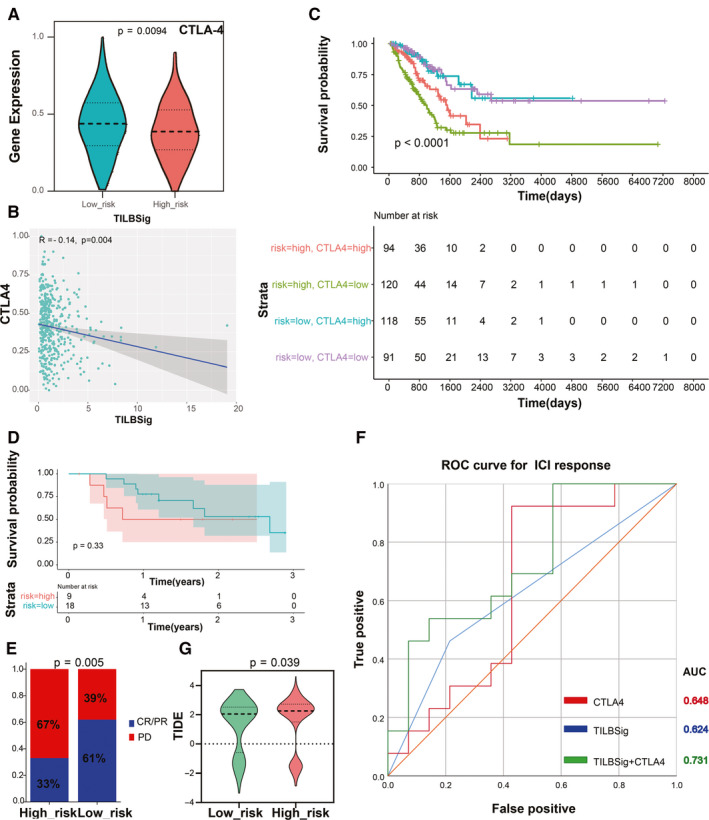
FIGURE 7.

TILBSig could predict the immunotherapeutic benefits. A, Violin plot of CTLA‐4 expression distribution in the low‐ and high‐risk groups (Wilcoxon rank‐sum test, p = 0.0094). B, Association between CTLA‐4 expression levels and TILBSig risk scores. C, Survival analysis among four patient groups stratified by the TILBSig and CTLA‐4 expression. According to the median expression of CTLA‐4, the patients were divided into high‐ and low‐CTLA‐4 groups. D, Kaplan–Meier curves for patients with high and low risk in the GSE78220 cohort. E, Rate of clinical response to immunotherapeutic in the high‐ and low‐risk groups in the GSE78220 cohort (complete response [CR], partial response [PR], progressive disease [PD]; Chi‐square test, p = 0.005). F, ROC curves measuring the predictive value of the TILBSig, CTLA‐4 expression, and combination of TILBSig and CTLA‐4 expression in the GSE78220 cohort. G, Differences in TIDE scores between the high‐ and low‐risk groups (Wilcoxon rank‐sum test, p = 0.039).
