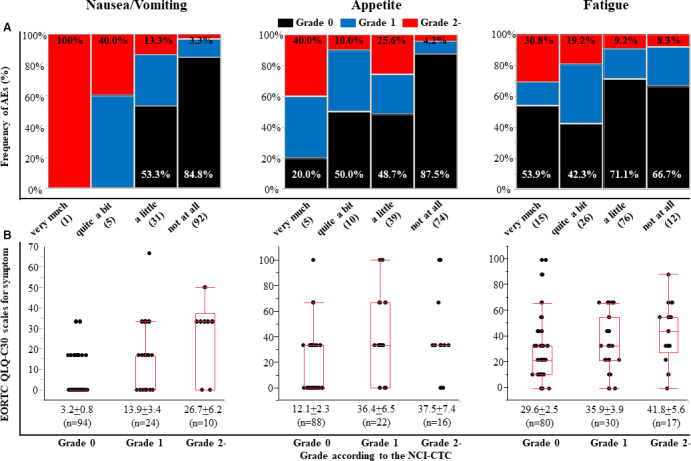
FIGURE 2.

Status of toxic severity between patient and physician reporting on symptomatic AEs. A, Distribution of NCI‐CTCAE grading reported by physicians according to four response categories (very much, quite a bit, a little, and not at all) reported by patients using the EORTC QLQ‐C30 for individual AEs (nausea/vomiting, appetite loss, or fatigue). Black, grade 0; blue, grade 1; red, grade 2. The numbers of patients shown in the parentheses. B, The symptomatic scores of EORTC QLQ‐C30 according to the NCI‐CTCAE grading for individual AEs (nausea/vomiting, appetite loss, or fatigue). Each data point represents the mean ±standard error of the mean.
