Figure 1.

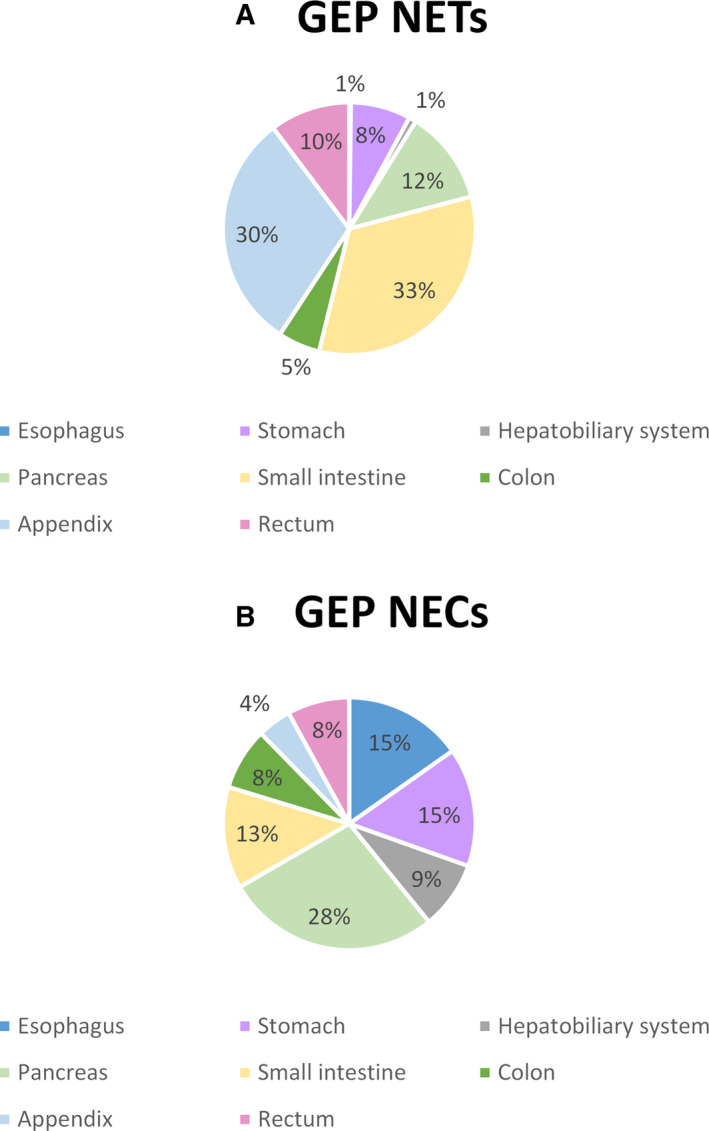
Anatomic distribution (%) of gastroenteropancreatic (GEP) neuroendocrine tumors (NET) tumors (A) and GEP neuroendocrine carcinomas (NEC) tumors (B) by site

Anatomic distribution (%) of gastroenteropancreatic (GEP) neuroendocrine tumors (NET) tumors (A) and GEP neuroendocrine carcinomas (NEC) tumors (B) by site