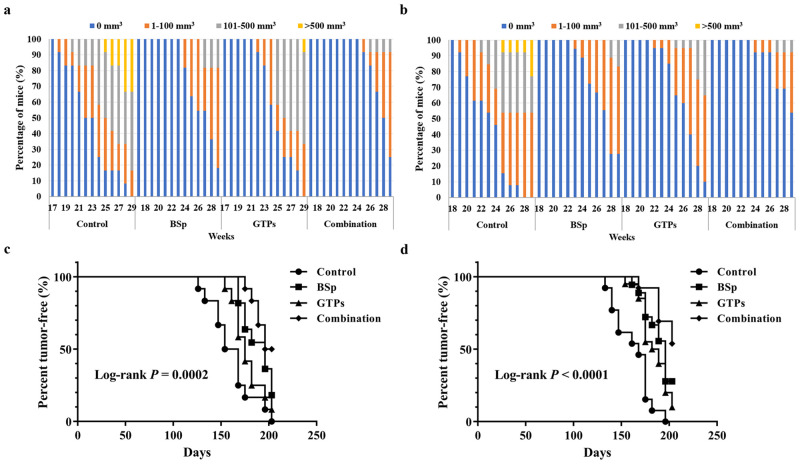
Fig 2. Tumor growth comparisons between control, BSp, GTPs and combination-fed mice dietary groups.
Female Her2/neu mice were monitored for tumor growth weekly. The delay in tumor growth volume and the percentage over the whole population in BSp, GTPs and combination dietary regimens as compared to control in the BE group (a) and in the LC group (b) as shown. Colors in (a) and (b) indicate different tumor volume ranges as shown in the legend above the graph. Tumor-free survival curves for cases classified in four dietary treatments of the BE group (c) and the LC group (d) were calculated using the Mantel-Cox proportional model and differences were tested using the log-rank statistic. n = 16~20 in dietary treatments of the BE group and n = 15~20 in dietary treatments of the LC group. Tumor growth was evaluated with Bonferroni adjustment for multiple comparisons between the dietary treatment groups (80% power, significance level of 0.01, alpha = 0.05 with Bonferroni adjustment for 4 comparisons).

