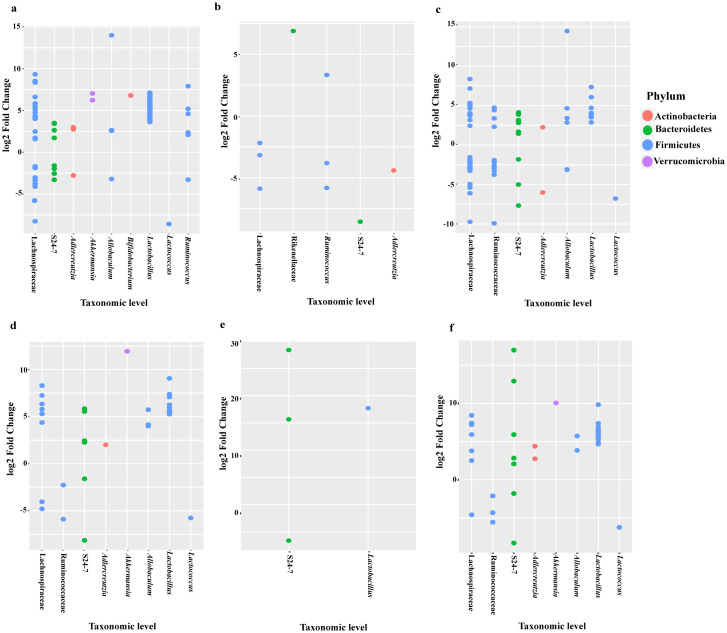
Fig 4. Log2 fold change of relative abundance of microbial species in mice before the onset of tumor.
(a) Dotplot of the bacterial abundance between BSp-fed and control-fed mice, (b) GTPs-fed and control-fed mice, (c) combination-fed and control-fed mice before the onset of tumor in the BE group (n = 8), (d) Dotplot of the microbial species abundance between BSp and control, (e) GTPs and control, (f) combination and control dietary treatment before the onset of tumor in the LC group (n = 5).

