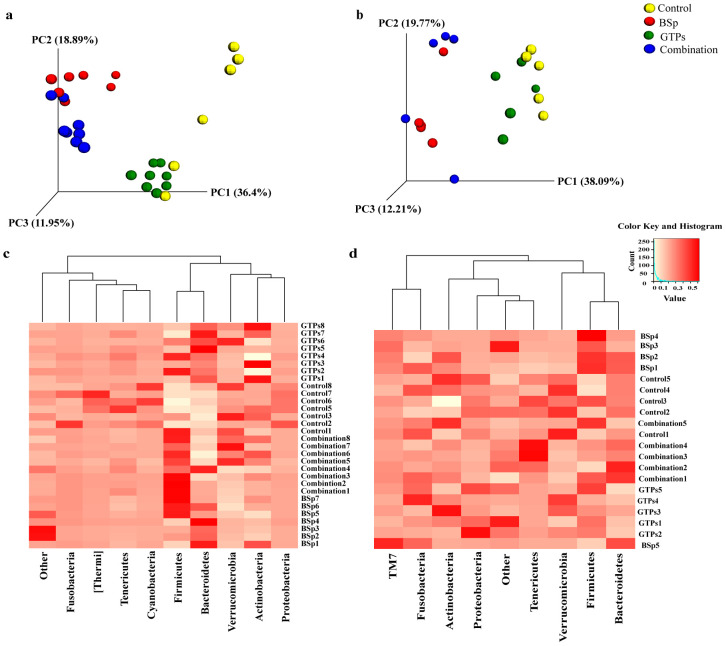
Fig 5. Changes in microbial composition by the dietary treatments after the onset of tumor in mice.
(a) After tumor onset, the 3D PCoA plot (Bray Curtis) showed a distinct clustering of the BSp-fed (red), GTPs-fed (green) and combination-fed diet groups (blue) as compared to the control-fed (yellow) in the BE group. (b) 3D PCoA plot (Bray Curtis) showed a distinct clustering of dietary groups after the tumor onset in the LC group. (c) Heatmap depicting the phylum level changes in microbial abundance by our dietary treatments in the BE group. (d) Heatmap depicting the post-tumor phylum level changes in microbial abundance by our dietary treatments in the LC group. The phylum levels of bacterial communities are represented in rows and columns correspond to biological replicates in the BE (n = 8) and LC (n = 5) groups. Higher expression levels are represented in red color and lower expression levels are represented in white color. Statistical analyses for association between bacterial communities of beta diversity was determined by using PERMANOVA.

