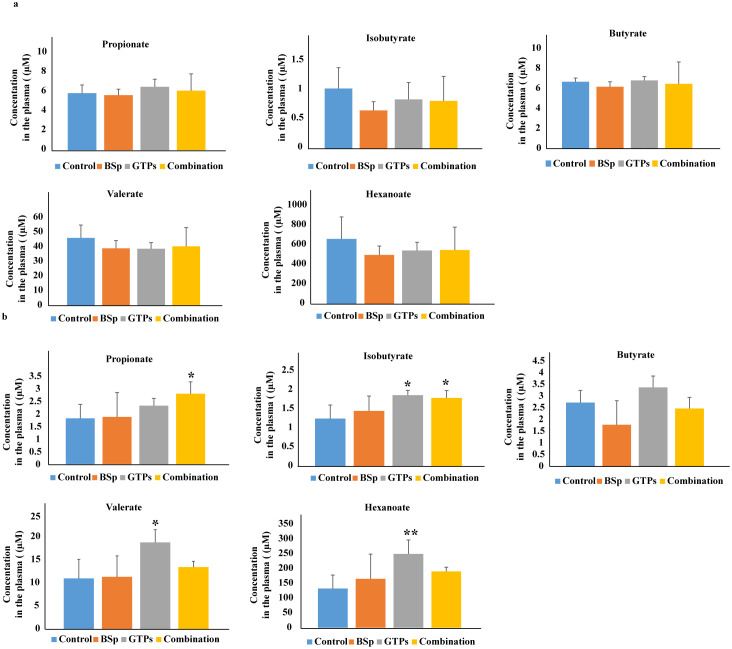
Fig 7. Analyses of plasma SCFAs levels in BSp-fed, GTPs-fed, combination-fed or control-fed mice.
(a) Concentrations of SCFAs propionate, isobutyrate, butyrate, valerate and hexanoate in our dietary treatment mice versus control treatment mice in BE group (b) Concentrations of the SCFAs in BSp-fed, GTPs-fed or combination-fed mice when compared with control-fed mice in LC group. Data are presented as mean ± standard deviation (SD) (n = 6). Significance was determined by using one-way independent ANOVA, followed by Tukey’s post-hoc test. * p < 0.05, ** p < 0.01, ***p <0.001.

