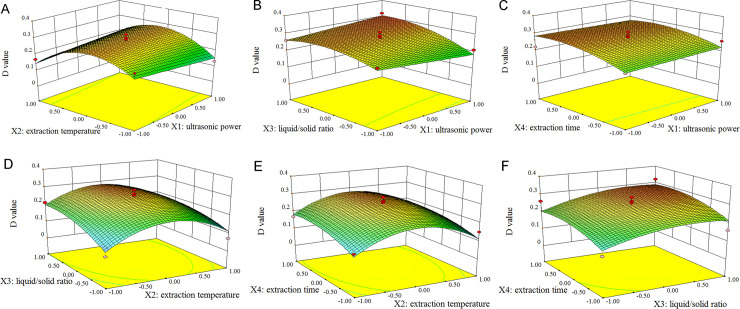
Fig 2. Response surface plots showing the effects of extraction parameters on the D values in the extraction of polysaccharides and triterpenoids from G. lucidum.
A, effect of ultrasonic power and extraction temperature; B, effect of ultrasonic power and liquid/solid ratio; C, effect of ultrasonic power and extraction time; D, effect of extraction temperature and liquid/solid ratio; E, effect of extraction temperature and extraction time; and F, effect of liquid/solid ratio and extraction time.

