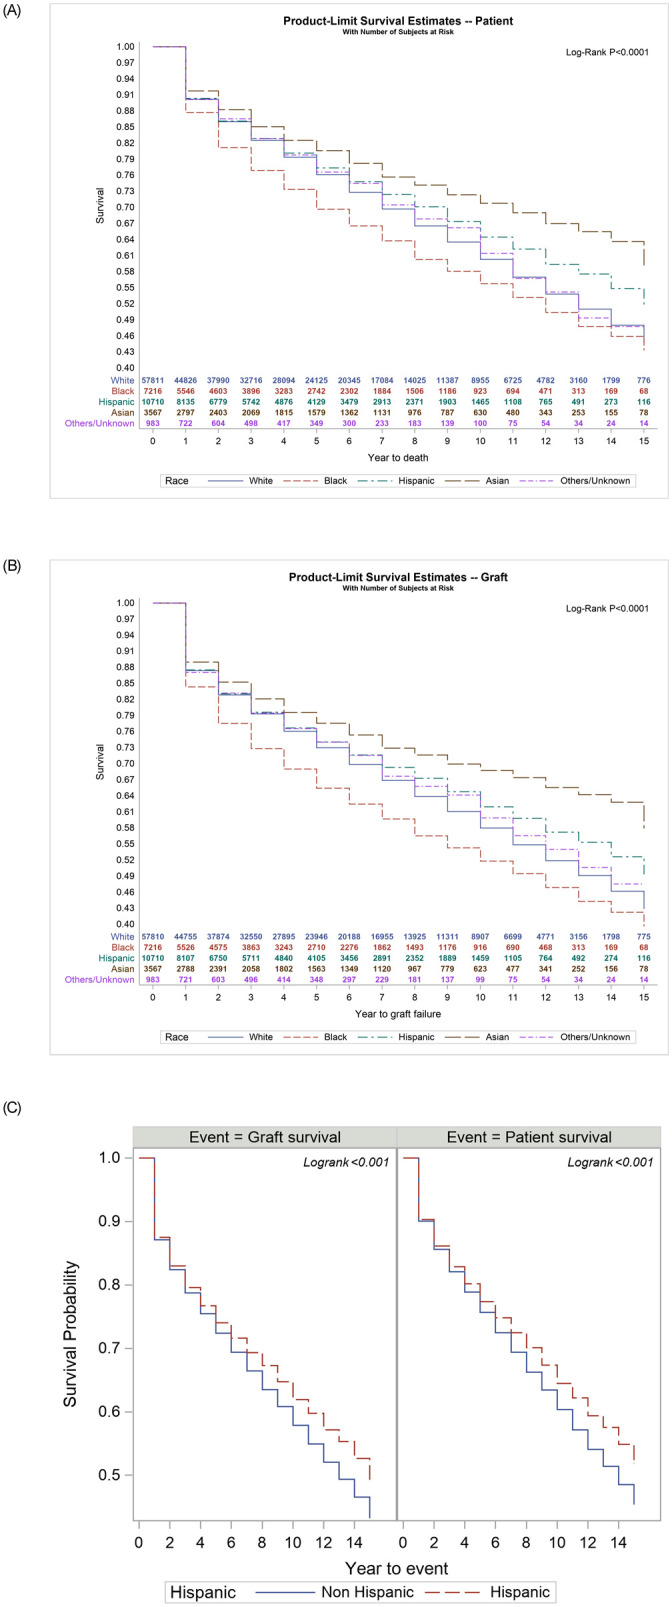
Fig 2.

A. Post liver transplantation Kaplan Meier patient survival stratified by races (number at risk at different time points shown in inner panel); B. Post liver transplantation Kaplan Meier graft survival stratified by races (number at risk at different time points shown in inner panel); C. Post liver transplantation Kaplan Meier patient and graft survival in Hispanics when compared to others.
