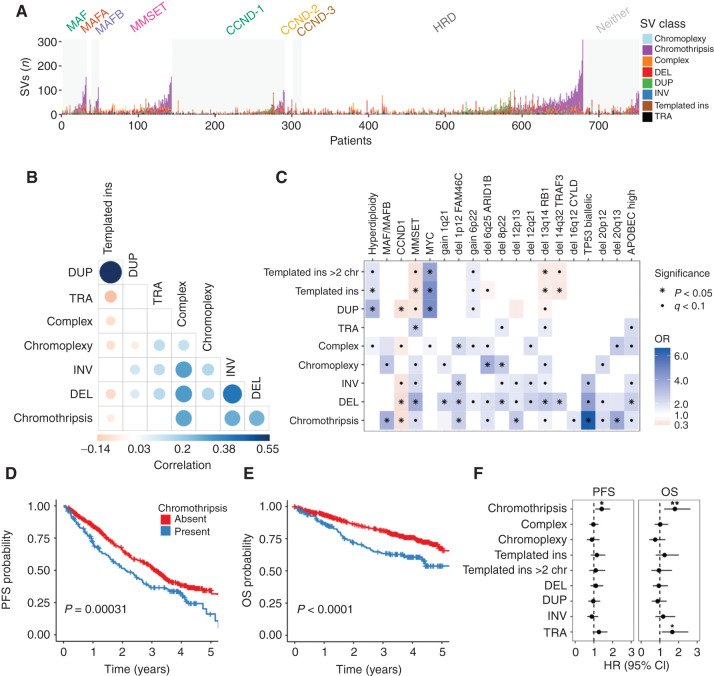
Figure 2.
Distribution and clinical impact of SVs in multiple myeloma. A, Stacked bars show the genome-wide burden of each SV class (color) in each patient (x-axis), grouped by primary molecular subgroup. B, Pairwise associations between the number of SVs of each class across patients in the CoMMpass cohort (n = 752). Color and size of points are determined by the magnitude of positive (blue) and negative (red) Spearman correlation coefficients, plotted only where q < 0.1. C, Association between SV classes and molecular features in the CoMMpass cohort (n = 752). OR for each pair of variables was estimated by Fisher exact test. Statistical significance is indicated by black dots (FDR < 0.1) and asterisks (Bonferroni–Holm adjusted P values < 0.05). For all templated insertions, templated insertions involving >2 chromosomes, chromothripsis, chromoplexy, and unspecified complex events, we compared patients with 0 versus 1 or more events. The remaining SVs were considered by their simple class (i.e., DUP, DEL, TRA, and INV), comparing the 4th quartile SV burden with the lower three quartiles. Kaplan–Meier plots for PFS (D) and OS (E) in patients with and without chromothripsis (shown in blue and red, respectively). F, HR for PFS and OS by SV type, estimated using multivariate Cox regression. Line indicates 95% CI from multivariate Cox regression models, with statistically significant features indicated by asterisks (*, P < 0.05; **, P < 0.01). The multivariate models included all SV variables (as defined above) as well the following clinical and molecular features: age, sex, Eastern Cooperative Oncology Group (ECOG) status, International Staging System (ISS) stage, induction regimen, gain 1q21, del FAM46C, del TRAF3, TP53 status, del RB1, high APOBEC mutational burden, hyperdiploidy, and canonical translocations involving CCND1, MMSET, MAF, MAFA, MAFB, and MYC (Supplementary Fig. S2).

