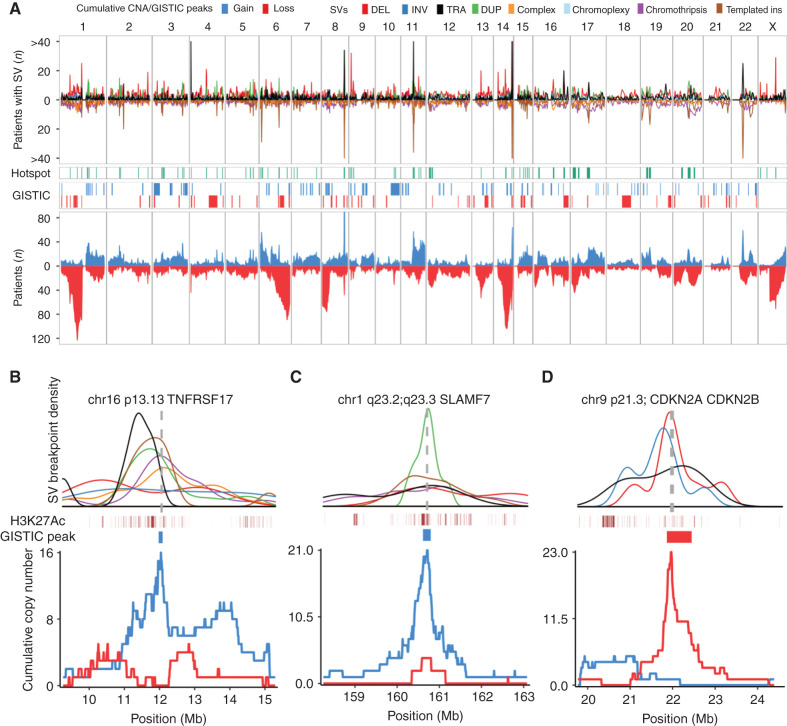
Figure 4.
Genome-wide distribution of structural variation breakpoints and hotspots. A, Top, genome-wide density of SV breakpoints shown separately for each class (legend above figure); simple classes are above the x-axis and complex classes below. Middle, distribution of SV hotspots (green) and recurrent copy-number changes (red/blue) identified by the GISTIC algorithm. Bottom, all copy number-changes caused by SV breakpoints, showing cumulative plots for gains (blue) and losses (red). B–D, Zooming in on three SV hotspots and showing the breakpoint density of relevant SV classes (colors indicated in legend above A) around the hotspot; active enhancers (H3K27Ac) and supporting GISTIC peaks (middle); and cumulative copy number (bottom). The SV density plots are annotated with the location of key driver genes as vertical gray dashed lines. B, Gain-of-function hotspot centered on TNFRSF17 (BCMA), dominated by highly clustered templated insertions, associated with focal copy-number gain of TNFRSF17. C, Gain-of-function hotspot involving four genes in the Signaling Lymphocyte Activation Molecule (SLAM) family of immunomodulatory receptors, including the gene encoding the mAb target SLAMF7. D, Deletion hotspot associated with copy-number loss centered on the cyclin dependent kinase inhibitors CDKN2A/CDKN2B.

