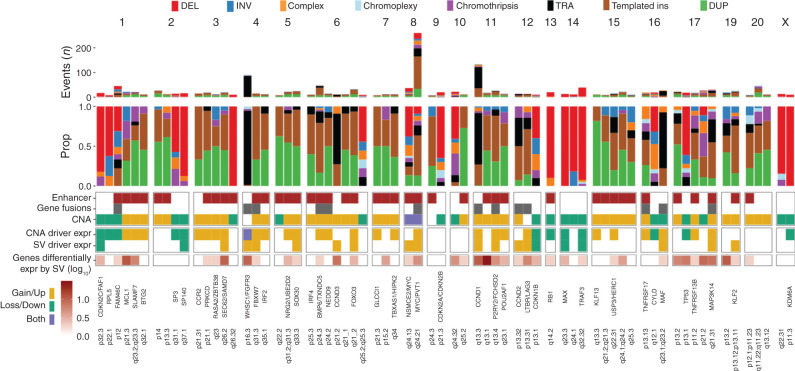
Figure 5.
Summary of SV hotspots. Summary of all 68 SV hotspots, showing (from the top) absolute and relative contribution of SV classes within 100 kb of the hotspot; involvement of active enhancers in multiple myeloma, and presence of putative driver gene fusions and copy-number changes; differential expression of putative driver genes by copy-number changes and/or SV involvement by linear regression; total number of genes in each hotspot differentially expressed by SV involvement (FDR < 0.1) after adjustment for copy-number changes; and known and candidate driver genes.

