
Figure 4. Distinctive Epicardial Response during Neonatal Heart Regeneration.
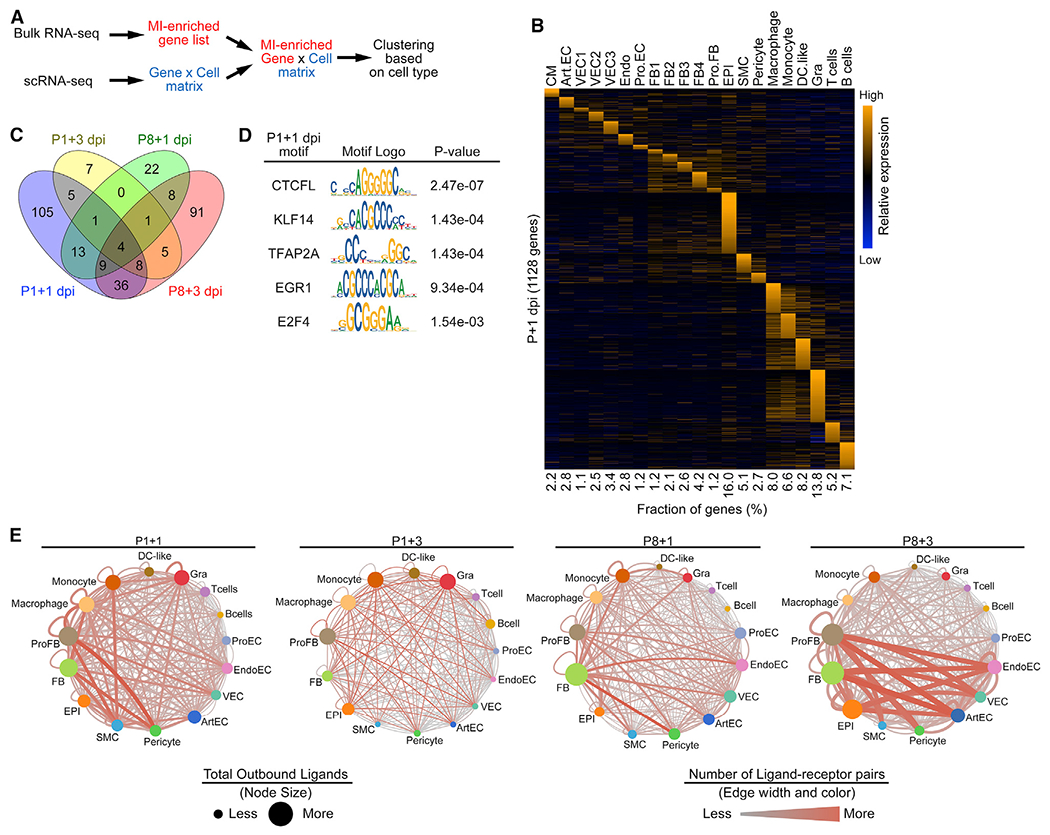
(A) Schematic illustration for the bioinformatics pipeline used to deconvolute bulk RNA-seq data using scRNA-seq data as a reference.
(B) Heatmap showing expression of cell-type-specific, injury-induced genes across different cell types in P1+1 dpi scRNA-seq data.
(C) Venn diagram showing numbers of epicardial injury-induced genes that are specific to or shared among P1+1 dpi, P1+3 dpi, P8+1 dpi, and P8+3 dpi time points.
(D) Table summarizing TF motifs enriched in open chromatin regions that are associated with epicardial-specific, MI-induced genes at P1+1 dpi.
(E) Injury-induced ligand-receptor interaction networks at P1+1 dpi (2,814 total interaction pairs), P1+3 dpi (474 total interaction pairs), P8+1 dpi (2,103 total interaction pairs), and P8+3 dpi (3,800 total interaction pairs). Size of the nodes denotes the total number of predicted ligand-receptor interactions initiated from the indicated cell types. The color and width of the lines connecting two nodes denote the number of predicted ligand-receptor interactions between connected cell types. The network illustrates the potentiality of cellular crosstalk events mediated by injury-induced ligand-receptor pairs but does not account for the anatomic position of different cell types.