
Figure 6. Heterogeneous Fibroblast Populations in Injured and Uninjured Neonatal Hearts.
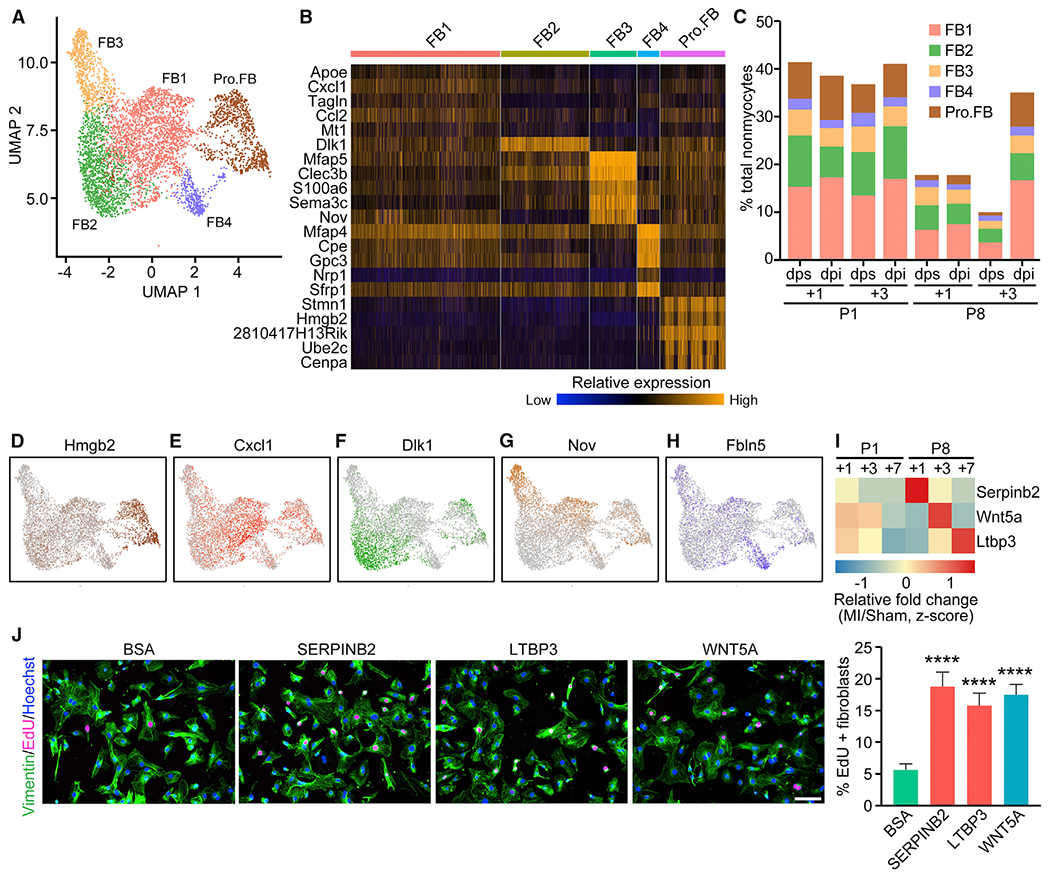
(A) UMAP representation of different FB sub-populations analyzed.
(B) Heatmap showing expression of top enriched genes for each FB sub-population.
(C) Percentage of each FB sub-population over total nonmyocytes within each sample.
(D–H) UMAP plots showing expression of Pro.FB-enriched gene Hmgb2 (D), FBI-enriched gene Cxcl1 (E), FB2-enriched gene Dlk1 (F), FB3-enriched gene Nov (G), and FB4-enriched gene Fbln5 (H).
(I) Heatmap showing relative fold induction (Z score) of Serpinb2, Wnt5a, and Ltbp3 expression at various time points after P1 or P8 MI detected by bulk RNA-seq.
(J) EdU incorporation (magenta) and vimentin immunofluorescent staining (green) of NRCF cells treated with 200 ng/mL BSA (negative control), 20 ng/mL recombinant SERPINB2, 100 ng/mL recombinant LTBP3, or 100 ng/mL recombinant WNT5A (positive control), with quantification showing the proportion of EdU-positive cells among vimentin-positive cells (fibroblasts) (n = 4 per each group; ****p < 0.0001). Scale bar, 100 μm.
See also Figure S6.