
Figure 7. Heterogeneity and Distinct Injury Response of Immune Cells.
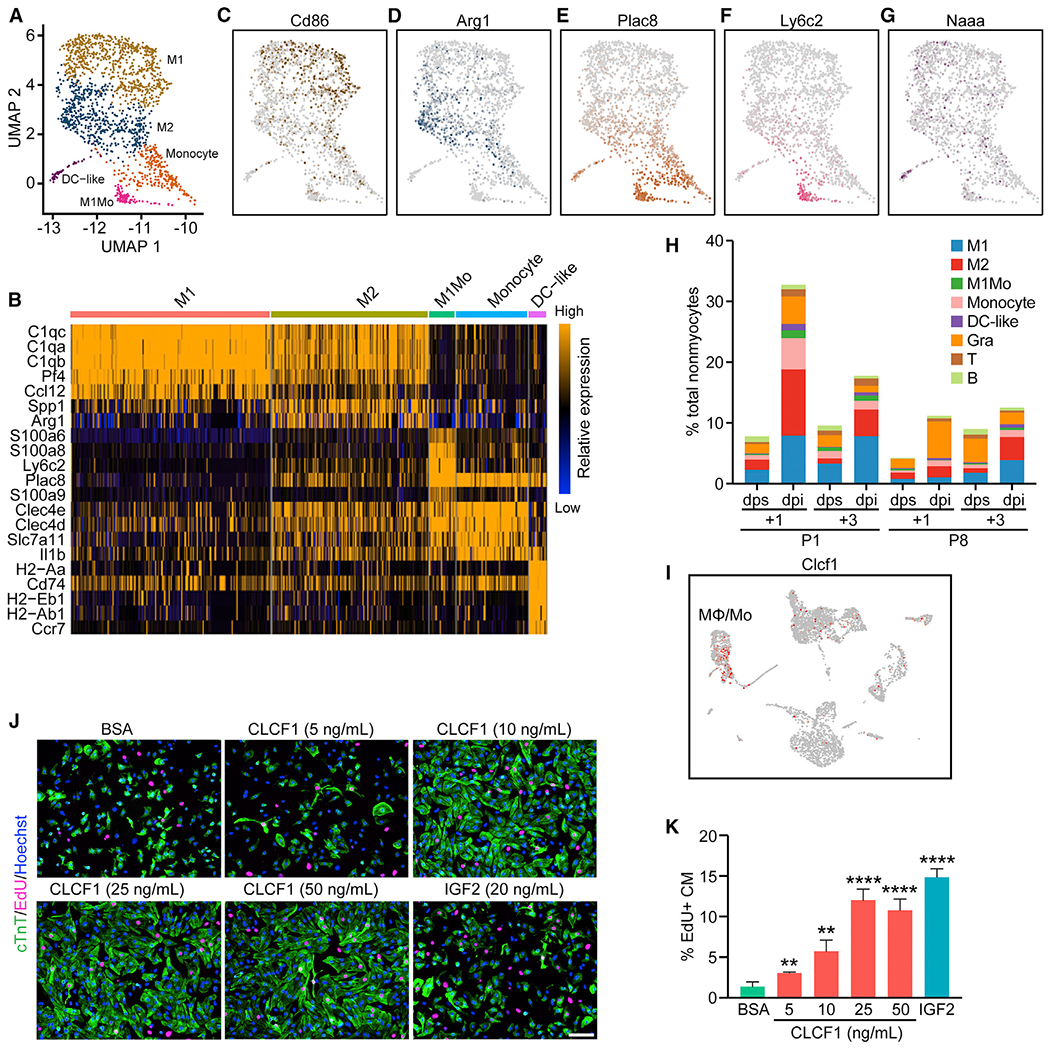
(A) UMAP representation of different myeloid cell populations analyzed.
(B) Heatmap showing expression of top enriched genes for each myeloid cell sub-population.
(C–G) UMAP plots showing expression of Cd86, an M1-macrophage marker gene (C); Arg1, an M2-macrophage marker gene (D); Plac8, a monocyte-enriched gene (E); Ly6c2, an M1 monocyte-enriched gene (F); and Naaa, a DC-like cell enriched gene (G).
(H) Percentage of each immune cell population over total nonmyocytes within each sample.
(I) UMAP plot showing expression of Clcf1 among different cell types present in the P1+1 dpi and dps scRNA-seq data.
(J) Representative images showing EdU incorporation (magenta) and cardiac troponin T (cTnT) immunofluorescent staining (green) of NRVM cells treated with 200 ng/mL BSA (negative control), 20 ng/mL recombinant insulin-like growth factor 2 (IGF2) (positive control), or different concentrations of recombinant CLCF1 (5, 10, 25, and 50 ng/mL). Scale bar, 100 μm.
(K) Quantification showing the proportion of EdU-positive cells among cTnT-positive cells (CM) after treatment of BSA, CLCF1 recombinant protein, or recombinant IGF2 (n = 4 per each group; **p < 0.01, ****p < 0.0001).
See also Figure S7.