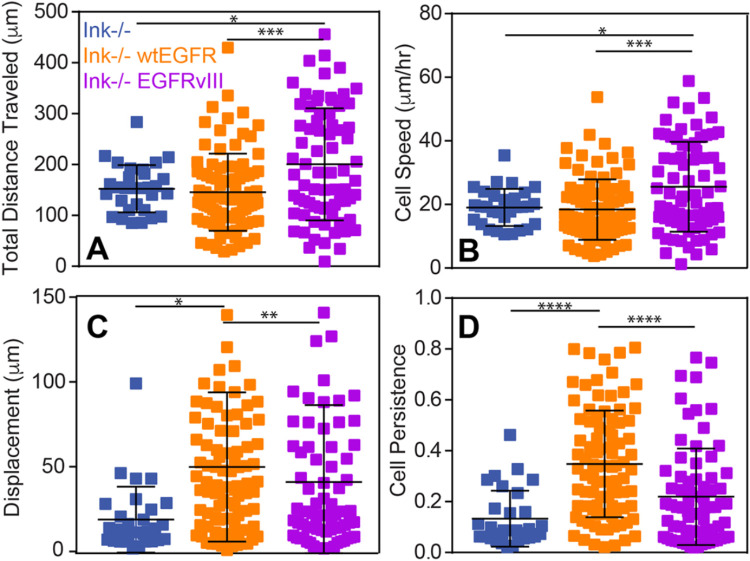
Fig. 2.
Migratory characteristics scale with adhesion and depend on EGFR. (A–C) Total cell migration distance (A), speed (B), displacement (C) and persistence (D) over 24 h is plotted for the indicated genotypes (n=3). *P<0.05, **P<0.01, ***P<0.001 and ****P<0.0001 assessed by paired Student’s t-test (n=30, 91 and 74 cells for Ink−/−-, wtEGFR- and EGFRvIII-expressing cells, respectively).

