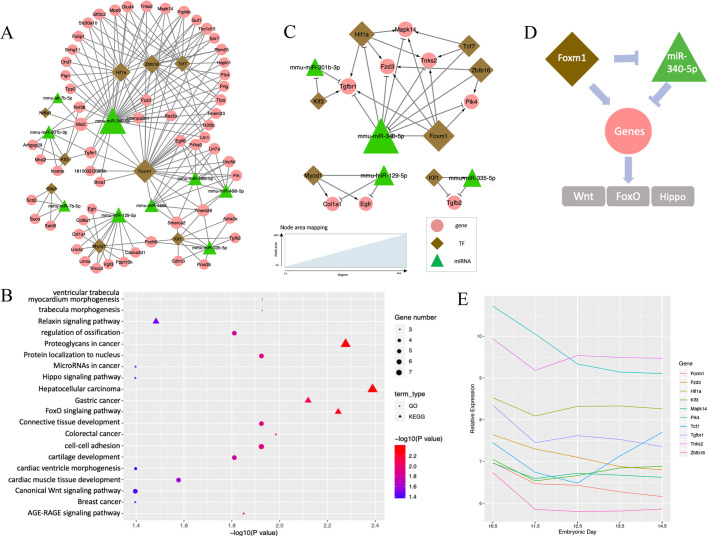
Fig. 2.
TF-miRNA co-regulatory network at E10.5-E11.5. (A) Co-regulation networks visualized by Cytoscape, Green triangles denote miRNAs, brown diamonds represent TFs and pink circles denote non-TF protein-coding genes. The area of the node is proportional to the degree in the network. (B) Bubble plots depict the pathways enriched in the regulatory networks. GO biological process terms (circles) and KEGG pathways (triangles) were used for the enrichment analysis. Color scheme reflects the adjusted P-values. The area of a circle or triangle is proportional to the number of enriched genes. (C) Wnt-FoxO-Hippo subnetwork for the expression and regulation changes of E10.5 to E11.5. (D) Putative model of Foxm1 and miR-340-5p regulation in the Wnt-FoxO-Hippo subnetwork. (E) Expression profiles of genes in the Wnt-FoxO-Hippo subnetwork along the developmental stage.

