
Fig 4. PD did not impact on subsequent CIA.
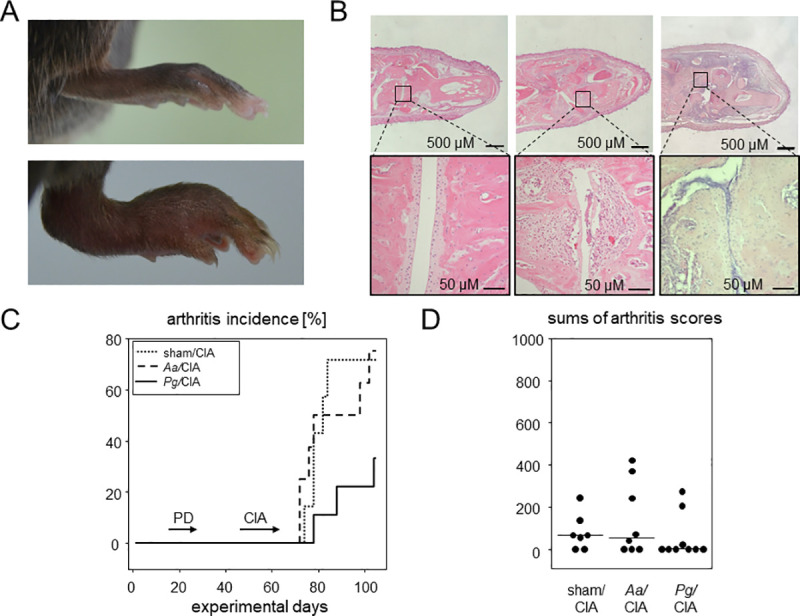
CIA led to macroscopically visible swelling of the paws and microscopic deterioration of the joints (A) A swollen hind paw resulting from CIA (lower panel) in comparison to the paw of a control (sham/noCIA) mouse (upper panel). (B) HE stained thin sections of hind paws reveal inflammatory infiltrates in Aa/CIA and Pg/CIA compared to a control specimen from sham/noCIA animals. (C) Inverted Kaplan-Meier curves show arthritis incidences over time. Horizontal arrows indicate periods of disease inductions. Numbers are n = 7 for sham/CIA, n = 8 for Aa/CIA and n = 9 for Pg/CIA. (D) Dot plots summarize the sums of macroscopic arthritis scores at endpoint, assessed every other day starting from boost. Every dot represents a single mouse. CIA: collagen induced arthritis; PD: periodontal disease.